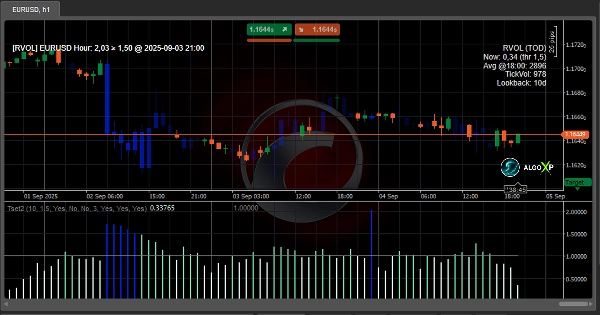
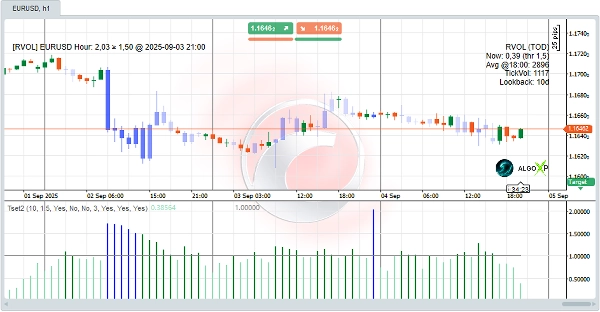
Индикатор
forex
indices
gbpusd
commodities
xauusd
nas100
nzdusd
prop
btcusd
eurusd
usdjpy
crypto
stocks
Логотип продукта "Tsunami Volume Surge - RVOL"
Tsunami Volume Surge - RVOL
0.0
07/09/2025
0
Desktop

🌊 Tsunami Volume Surge(RVOL + Time-of-Day) is a cTrader indicator designed to show traders when the market is truly active. Instead of looking only at absolute volume, it compares current market activity with its usual levels at the same time of day.

The main idea is simple: if volume is significantly higher than normal, the move is more likely driven by real market participants and has greater strength. The indicator highlights these situations using a color-coded histogram, bar coloring on the chart, and convenient alerts.

📊 How to use 

There are many ways to use Tsunami Volume Surge:

Visual confirmation
Colored candles make it easy to see which bars have real energy behind them, without staring at numbers.ts.

Filter weak signals
If volume is below normal (RVOL < 1.0), the market lacks interest. Avoid signals during such conditions.

Confirm breakouts
A breakout supported by high RVOL is far more reliable than one on low volume. Quasar Volume helps you spot the difference.

Time-of-day analysis
Different markets have their own rhythm. This indicator shows at which hours a symbol usually becomes active.

News trading
During major news events, RVOL often spikes. Setting a higher threshold (e.g. 3.0) helps you catch these explosive moves.


✅ Main Features

  • Automatic Relative Volume (RVOL) calculation — instantly shows when market activity is above or below its usual level.
  • Color-coded histogram — clear visual separation of low, normal, and high volume bars.
  • Dynamic candle coloring — bars are tinted based on strength of volume; the bigger the surge, the stronger the highlight.
  • Configurable thresholds — set your own sensitivity (e.g. 1.5 for scalping, 3.0 for news trading).
  • Alerts & pop-ups — get notified when volume crosses your chosen threshold, with time and date.
  • Info panel — displays live RVOL values, averages, and settings at a glance.
  • Baseline line (1.0) — quick reference to normal activity levels.
  • Lightweight and fast — designed to run smoothly even on low timeframes (M1, M5).

🎯 Perfect for

  • Algo developers — RVOL values can be used as a filter or condition in automated cBots.ar shading make the trend easy to read.
  • Scalpers — confirm if a breakout or micro-trend has real strength behind it.
  • Intraday traders — identify the most active times of day and avoid quiet periods.
  • Swing traders — filter false moves and focus only on breakouts with strong participation.
  • News traders — instantly see volume spikes during economic releases and react faster.
  • Beginner traders — simple and intuitive visuals make it easy to understand when the market is “alive” or “dead”.
Больше от этого автора
Индикатор
forex
prop
usdjpy
JPY Samurai Breakout Lite
⚔️ JPY Samurai Breakout Lite — Simple Breakout Indicator for cTrader ⚔️
Индикатор
forex
breakout
prop
+1
JPY Samurai Breakout Pro
⚔️ JPY Samurai Breakout Pro — Professional Breakout Indicator for cTrader ⚔️
сиБот
forex
prop
commodities
+3
Maya Gold Grid ATR - TEST VERSION
🌞 Maya Gold Grid ATR is a professional trading robot designed exclusively for XAUUSD (Gold) on the cTrader .🌞
Индикатор
forex
indices
gbpusd
+10
Nebula Range Filter Pro
⚡Nebula Range Filter is a professional trend filter indicator for cTrader⚡
сиБот
forex
prop
xauusd
+3
Maya Gold Grid ATR
🌞 Maya Gold Grid ATR is a professional trading robot designed exclusively for XAUUSD (Gold) on the cTrader .🌞
Вам также может понравиться
Breakout Mode Patterns
Brooks price action breakout mode patterns
SessionPowerZonesPro
Highlights market sessions & overlaps with real-time range & volume stats – perfect for pro scalpers.
Индикатор
breakout
bollinger
supertrend
+3
Fibonacci Linear Regression Multi-timeframe
Combining Fibonacci levels and regression to analyze multidimensional market trends across multiple timeframes¡
Time To Break Even Lite Version
This is the trial version of Time To Break Even, which help you time your trade entry.
Series - FXMaster
Consecutive Series Moves — Reveal the True Pulse of Price Action
Индикатор
breakout
btcusd
supertrend
+4
Multi-Level Candle Bias Tracker
Price direction by calculating the probability of reaching new highs/lows. Shows levels & stats📈
ADT_bigCandles
Outside Candle Detector: Highlights major candles/zones with ATR filter & pattern labels. By Avydel Talbo, prop trader.
CandleCounterAlex
CandleCounterAlex – Candle Cycle Counter with Colors and Adjustable Position.
Reko Wic
Visualize global Forex trading sessions with clear time blocks for better timing and strategy planning.
IR VLine
don't move to the end of chart after timeframe changing. it should be better to use for near history. for long history
Индикатор
forex
indices
prop
+3
OBScope
A cutting-edge indicator designed to detect and visualize high-probability zones based on swing highs, swing lows.
ZigZag T3
Three ZigZag lines
Zig zag v.1
ZigZag Pro – Multi-Swing Indicator for cTrader Description: ZigZag Pro is a powerful and fully customizable swing indica
Goldenhours
The Session Golden Hours indicator is designed for serious traders looking to visualize high-probability
E7 cTrader User ID
cTrader ID
Индикатор
forex
breakout
commodities
+1
Advanced Donchian Zones
MTF Donchian: Identify trend breakouts & key zones with precision. Perfect for swing & day traders seeking accuracy!
LaguerreRSI
Laguerre RSI: smoother, faster RSI with less noise. Great for spotting reversals and timing entries.
Moving Average channel
This indicator is designed to display customizable moving averages (MAs) on a chart.