
Opis
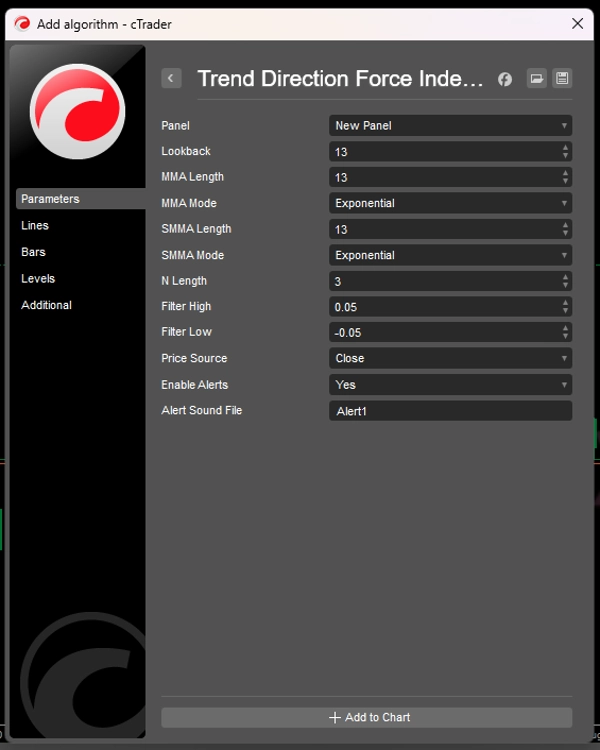
Indeks Siły Kierunku Trendu (TDFI) Trend Direction Force Index (TDFI) jest potężnym wskaźnikiem opartym na momentum, zaprojektowanym, aby pomóc traderom precyzyjnie identyfikować silne ruchy trendu oraz potencjalne odwrócenia. Analizując zależność między dwoma średnimi kroczącymi oraz ich tempem zmian, TDFI filtruje szumy rynkowe i podkreśla możliwości handlowe o wysokim prawdopodobieństwie sukcesu.
Kluczowe cechy:
✅ Wyraźna identyfikacja trendu – Wizualnie rozróżnia bycze (zielone) i niedźwiedzie (czerwone) momentum na podstawie konfigurowalnych progów.
✅ Adaptacyjne wygładzanie – Wykorzystuje różne typy średnich kroczących (EMA, WMA, Hull, TEMA itd.) dla optymalnej reaktywności.
✅ Redukcja szumów – Dynamiczna normalizacja zapewnia, że sygnały wywołują tylko istotne ruchy cen.
✅ Konfigurowalne alerty – Otrzymuj powiadomienia w czasie rzeczywistym, gdy trendy się wzmacniają lub odwracają.
✅ Działa na wszystkich interwałach czasowych – Skuteczny dla skalpowania, day tradingu i swing tradingu.
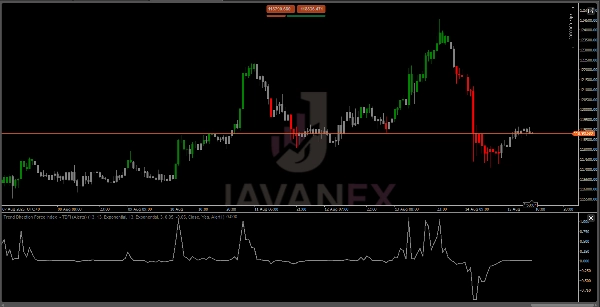
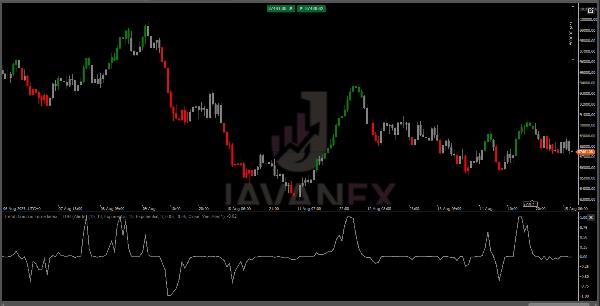
Jak działa TDFI
TDFI mierzy siłę trendu, analizując dywergencję i momentum między dwoma specjalnie dostrojonymi średnimi kroczącymi:
- MMA (Główna średnia krocząca) – Śledzi krótkoterminowe momentum cenowe
- SMMA (Wygładzona średnia krocząca) – Identyfikuje podstawowy trend
Następnie wskaźnik oblicza:
🔹 Siłę dywergencji – Jak bardzo MMA są od siebie oddalone (siła trendu)
🔹 Przyspieszenie momentum – Jak szybko porusza się trend
🔹 Znormalizowany wynik – Skaluje sygnały, aby uniknąć wartości ekstremalnych
Gdy te siły się łączą:
- TDFI > Górny próg (Zielony) = Silne bycze momentum
- TDFI < Dolny próg (Czerwony) = Silne niedźwiedzie momentum
- Pomiędzy progami (Szary) = Neutralny/konsolidacja
Podsumowanie
Opinie klientów
5 | 75 % | |
4 | 25 % | |
3 | 0 % | |
2 | 0 % | |
1 | 0 % |


