
Deskripsi
Lacak Pergerakan Aset Pasar dengan Pemindai Osilator secara Real-Time!
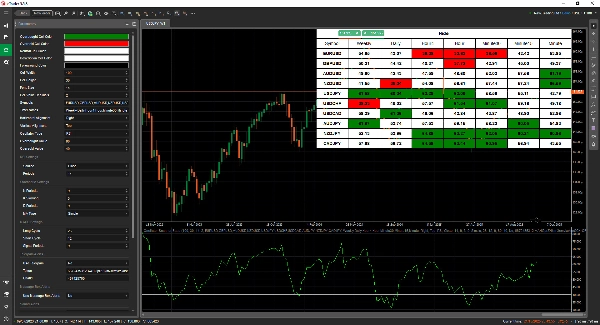
Dengan dasbor yang mudah dan kuat, Pemindai Osilator adalah alat yang sempurna untuk para pedagang yang mengandalkan sinyal momentum dan osilator di berbagai aset dan periode.
Kemampuan untuk melihat dan membandingkan data osilator secara real time dengan pengaturan yang dapat dikonfigurasi memberi Anda keuntungan untuk dapat mengambil tindakan lebih cepat dan lebih cerdas.
Osilator yang Tersedia:
- RSI
- Stochastic D
- Stochastic K
- MACD
- MACD Signal
- Accelerator Oscillator
- Awesome Oscillator
- Bears Power
- BullsPower
- ChandeMomentumOscillator
- CommodityChannelIndex
- CyberCycle
- DeMarker
Berbagai Jenis Peringatan - Terima Notifikasi dengan Cepat
Terima notifikasi kapan pun osilator melewati kriteria overbought atau oversold yang Anda personalisasi. Dengan cara ini, Anda tidak akan melewatkan peristiwa pasar yang penting.
🏍 Fitur Penting:
✅ Daftar Pantau yang Sepenuhnya Dapat Dipersonalisasi: Pilih periode waktu dan simbol mana yang ingin Anda pantau.
Anda dapat mengubah level overbought dan oversold sesuai dengan pendekatan trading Anda.
✅ Pergantian Grafik Cepat: Klik pada sel mana pun untuk mengakses grafik lain.
✅ Desain Ringkas dan Berbasis Data: Sempurna untuk membuat keputusan dengan cepat tanpa membuang waktu menavigasi antar grafik.
Audiens ideal untuk ini adalah para trader swing dan posisi yang memantau kekuatan tren. Mengetahui cara mengenali perubahan momentum dan pembalikan cepat sangat penting bagi trader harian dan scalper.
Anda Akan Selalu Mendapat Informasi tentang Perubahan Momentum yang Krusial!
Pemindai Osilator adalah alat yang hebat untuk memantau situasi momentum, seperti konfirmasi, pembalikan, dan breakout.
🔥 Dapatkan sekarang untuk berdagang dengan lebih cerdas!
Ringkasan
Users can personalize watchlists by selecting specific symbols and time periods, and adjust overbought and oversold levels to fit their trading strategies. The tool provides alert notifications when oscillator values cross user-defined thresholds, enabling timely responses to market momentum shifts such as confirmations, reversals, and breakouts.
The interface supports quick chart switching by clicking on any data cell, facilitating efficient analysis without navigating away from the dashboard. Oscillator Scanner is suited for swing and position traders focusing on trend strength, as well as day traders and scalpers who need to identify momentum changes rapidly. It supports multiple markets including Forex, indices, commodities, and cryptocurrencies.
Ulasan pelanggan
5 | 67 % | |
4 | 33 % | |
3 | 0 % | |
2 | 0 % | |
1 | 0 % |


