
Описание
Карта корреляций – ваш незаменимый инструмент для анализа рынка
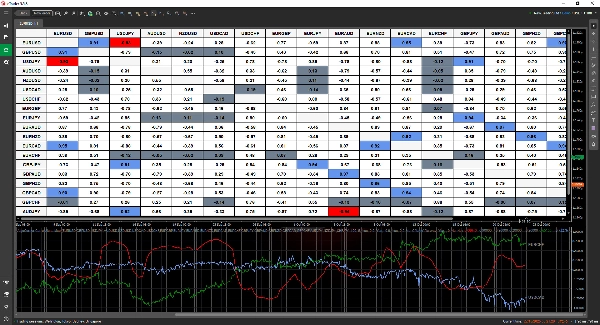
Карта корреляций – мощный и в то же время интуитивно понятный индикатор, который помогает быстро выявлять взаимосвязи между активами. Благодаря удобной табличной форме вы можете мгновенно обнаруживать корреляции и принимать более обоснованные торговые решения.
✅ Настройте свой анализ – выбирайте и сравнивайте столько торговых пар, сколько позволяет ваша платформа.
✅ Гибкие таймфреймы – анализируйте корреляции на любом временном интервале, соответствующем вашей стратегии.
✅ Четкое и адаптивное отображение – выбирайте между десятичным (-1 до 1) и процентным (-100% до 100%) форматами.
✅ Умное выделение – легко определяйте сильные и слабые корреляции с помощью настраиваемой цветовой кодировки.
✅ Оповещения в реальном времени – будьте в курсе изменений значений корреляции благодаря уведомлениям.
✅ Интерактивные данные – нажимайте на любую ячейку, чтобы отслеживать, как меняются корреляции со временем.
✅ Постоянные улучшения – получайте будущие обновления без дополнительной платы.
Откройте ключевые рыночные взаимосвязи и усовершенствуйте свою торговую стратегию с помощью Карты корреляций! 🚀
Сводка
Key features include customizable display options with correlation values shown in decimal (-1 to 1) or percentage (-100% to 100%) formats, and smart color-coded highlighting to quickly identify strong or weak correlations. Users can interact with the data by clicking on any cell to track how correlations evolve over time. Real-time alerts notify users of significant changes in correlation values, aiding timely decision-making.
This tool is intended to help traders uncover relationships between assets efficiently, supporting more informed market analysis and strategy refinement.
Отзывы покупателей
5 | 67 % | |
4 | 33 % | |
3 | 0 % | |
2 | 0 % | |
1 | 0 % |


