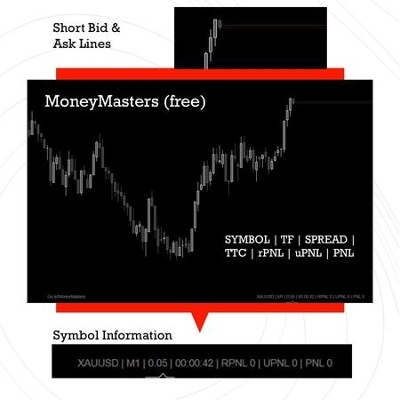
Deskripsi
Apa itu Kurva Coppock?
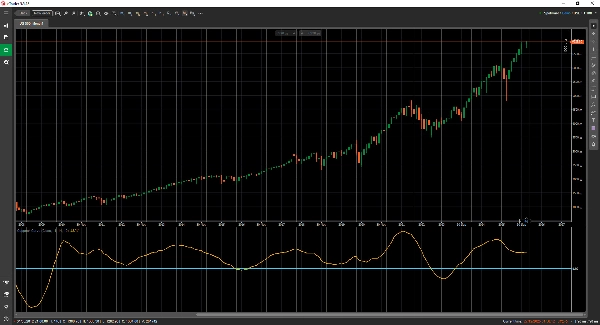
Kurva Coppock adalah indikator momentum jangka panjang yang awalnya dirancang untuk mengidentifikasi titik terendah pasar utama di S&P 500. Ini dibuat pada tahun 1962 oleh ekonom Edwin Coppock, yang terkenal diminta oleh Gereja Episkopal untuk menemukan peluang pembelian berisiko rendah untuk dana abadi mereka.
Dalam istilah sederhana, ini adalah osilator pengikut tren yang memberi tahu Anda kapan pasar bearish kemungkinan telah mencapai titik terendah dan pasar bullish baru sedang dimulai.
“Rahasia” (Cara Kerjanya)
Tidak seperti banyak indikator yang reaktif dan mudah berubah, Kurva Coppock sengaja dibuat lambat. Ini dihitung dengan mengambil Rata-Rata Bergerak Tertimbang (WMA) dari jumlah dua Tingkat Perubahan (ROC) yang berbeda.
Coppock = WMA(10) dari (ROC(14) + ROC(11))
Logikanya:
Ini mengukur laju perubahan momentum harga selama periode panjang (biasanya 11 dan 14 bulan). Dengan menghaluskan data ini menggunakan rata-rata tertimbang, hampir semua kebisingan pasar jangka pendek disaring keluar.
Fakta Menarik:
Coppock dilaporkan bertanya kepada para uskup berapa lama waktu yang dibutuhkan seseorang untuk pulih dari kesedihan kehilangan orang yang dicintai. Mereka mengatakan “11 hingga 14 bulan.” Dia menerapkan kerangka waktu yang sama pada pasar, dengan alasan bahwa psikologi pasar mengikuti siklus kesedihan dan pemulihan yang serupa.
Mengapa Ini Berguna?
Para pedagang dan investor menyukai Kurva Coppock karena tiga alasan utama:
- Menyaring Kebisingan: Karena dihitung pada kerangka waktu bulanan (secara tradisional), ini mengabaikan volatilitas harian atau bahkan mingguan. Ini tidak sering memicu, tetapi ketika terjadi, biasanya signifikan.
- Sinyal Beli yang Jelas: Sinyal bersifat biner dan mudah dibaca. Sinyal “Beli” dihasilkan ketika kurva berada di bawah garis nol dan mulai naik (berbalik ke atas).
- Jangkar Psikologis: Ini mencegah Anda mencoba “menangkap pisau yang jatuh.” Ini memaksa Anda menunggu sampai momentum secara matematis bergeser dari negatif ke positif sebelum memasuki posisi.
Kapan Menggunakannya
- Terbaik untuk: Investasi jangka panjang, alokasi pensiun, dan mengidentifikasi awal dari kenaikan pasar baru.
- Tidak untuk: Perdagangan harian atau short selling. Ini tidak dirancang untuk mengidentifikasi sinyal jual atau puncak pasar.