
Description
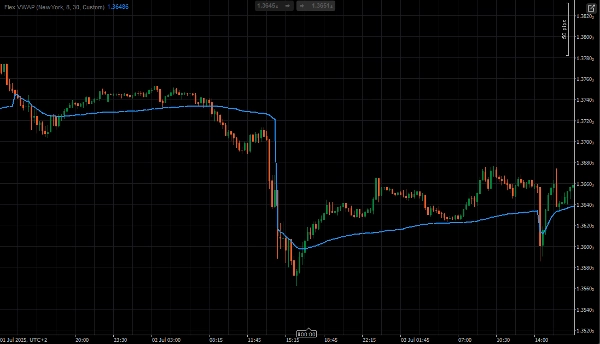
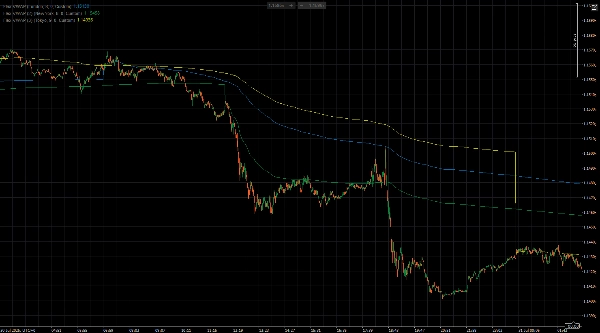
L'indicateur Flex VWAP fournit un calcul du prix moyen pondéré par le volume avec des périodes de réinitialisation hautement personnalisables incluant des intervalles annuels, mensuels, hebdomadaires, quotidiens, horaires et des réglages de temps personnalisés. Il prend en charge plusieurs configurations de fuseaux horaires (New York, Londres, Tokyo, Sydney, Local) permettant aux traders d'aligner les calculs VWAP avec des sessions de trading spécifiques. Les utilisateurs peuvent définir des heures de réinitialisation personnalisées jusqu'à la minute pour une gestion précise des sessions et des stratégies de trading personnalisées. La ligne VWAP se met à jour en temps réel en utilisant la méthodologie du prix typique et fournit une référence fiable pour les niveaux de trading institutionnels et l'analyse du biais du marché.
Paramètres de session Forex
==================
Session de Londres
Fuseau horaire de base : Londres
Heure personnalisée : 8
Minute personnalisée : 0
Période de réinitialisation : Personnalisée
Session de New York
Fuseau horaire de base : NewYork
Heure personnalisée : 8
Minute personnalisée : 0
Période de réinitialisation : Personnalisée
Session de Tokyo
Fuseau horaire de base : Tokyo
Heure personnalisée : 9
Minute personnalisée : 0
Période de réinitialisation : Personnalisée
Paramètres de session de la Bourse
==========================
Session de Londres
Fuseau horaire de base : Londres
Heure personnalisée : 8
Minute personnalisée : 0
Période de réinitialisation : Personnalisée
Session de New York
Fuseau horaire de base : NewYork
Heure personnalisée : 9
Minute personnalisée : 30
Période de réinitialisation : Personnalisée
Session de Tokyo
Fuseau horaire de base : Tokyo
Heure personnalisée : 9
Minute personnalisée : 0
Période de réinitialisation : Personnalisée
Résumé
Avis clients
5 | 100 % | |
4 | 0 % | |
3 | 0 % | |
2 | 0 % | |
1 | 0 % |


