
Price Change Bundle 1.0 BT
Indicateur
2 achats
Version 1.0, Aug 2025
Windows, Mac
4.0
Avis : 1
Description
Pack de changement de prix — 3 indicateurs, 1 logique.
Les outils de ma propre configuration (Offre & Demande + ZigZag personnalisé). Conçus pour montrer comment le prix évolue réellement autour des clôtures des TF supérieurs.
Activez ou désactivez n'importe quel module — activer/désactiver Niveaux, Barres, Histogramme individuellement.
Modules
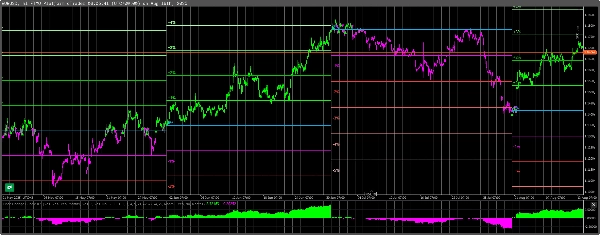
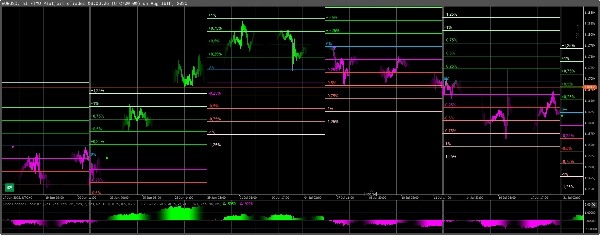
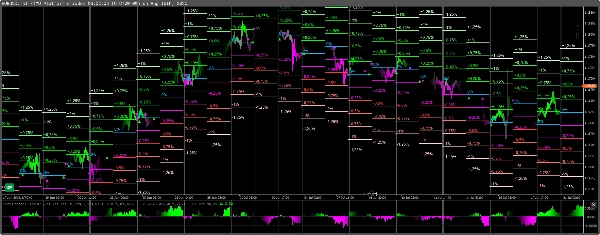
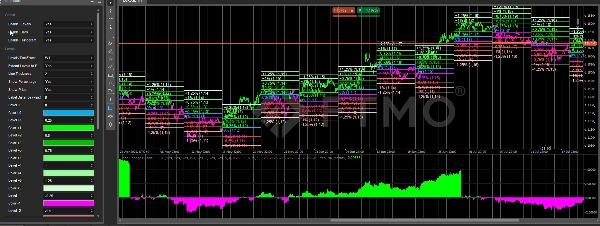
Niveaux de changement de prix
- Trace des zones en pourcentage (±0,25…±1,25%) dans la période sélectionnée.
- Chaque zone est mesurée à partir de la ligne de base 0% et affiche % et prix.
- Option pour étendre les lignes jusqu'à la fin de la période pour des cartes hebdomadaires/mensuelles nettes.
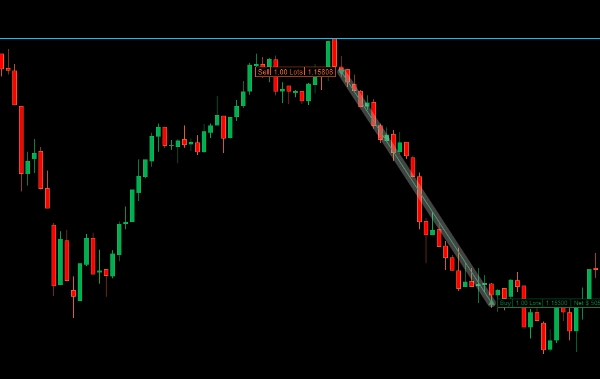
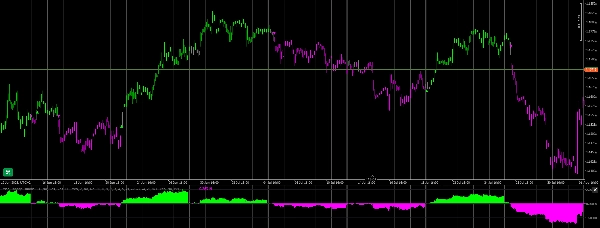
Barres de changement de prix
- Colore les chandeliers selon le régime Plein Au-dessus/Au-dessous par rapport au pivot TF.
- À utiliser de préférence à la clôture de la barre pour les entrées et une lecture rapide du régime.
- Comprend les flèches Changement de direction & Réentrée (après neutre → même côté).
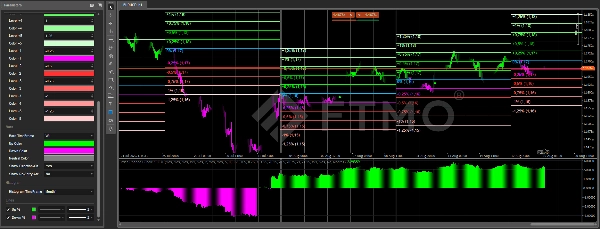
Histogramme de changement de prix
- Montre le développement global en pourcentage par rapport à la même référence TF (Up% / Down%).
- Idéal pour repérer accélérations/ralentissements en un coup d'œil.
Pourquoi ça marche — « Secrets du mouvement des prix »
- Les professionnels s'ancrent aux clôtures précédentes des TF supérieurs (MN/W1/D1).
- Les distances en % mesurées depuis cet ancrage agissent comme des aimants/cibles pratiques.
- Une bougie entièrement au-dessus/au-dessous du pivot définit le régime ; la réentrée après neutre continue souvent le mouvement.
Utilisation flexible
- Choisissez n'importe quelle période par module (par ex., Niveaux MN • Barres W1 • Histogramme D1).
- Fonctionne sur tout type de graphique, y compris Renko/intervalle/tick (les calculs utilisent vos TF basés sur le temps sélectionnés).
- Pas de repaint. Léger.
Vidéo & Support
- Une vidéo pas à pas (installation, préréglages, exemples de trading) sera publiée bientôt.
- Les acheteurs peuvent me contacter directement pour toute question, aide à la configuration ou retour. Je réponds personnellement.
Résumé
Résumé IA
Price Change Bundle 1.0 BT is a composite indicator consisting of three modules—Levels, Bars, and Histogram—designed to analyze price movements relative to higher timeframe closes. It integrates concepts from Supply & Demand and a custom ZigZag to reveal how price behaves around significant reference points.
- Price Change Levels: Displays percentage zones (±0.25% to ±1.25%) from a 0% baseline within a selected timeframe, showing both percentage and price values. Lines can be extended to the period’s end for clear weekly or monthly mapping.
- Price Change Bars: Colors candles based on their position relative to the timeframe pivot, indicating regimes with full above/below coloring. Includes arrows signaling direction changes and re-entries after neutral phases, aiding entry decisions.
- Price Change Histogram: Illustrates overall percentage development (Up%/Down%) against the same timeframe reference, facilitating quick identification of acceleration or slowdowns.
Each module can be toggled on or off independently and configured with different timeframes. The indicator works on any chart type, including Renko, range, and tick charts, using time-based timeframe calculations. It anchors calculations to previous closes of higher timeframes (monthly, weekly, daily) and does not repaint. Buyers have access to direct support from the developer.
Profil de l'indicateur
Avis clients
4.0
Avis : 1
5 | 0 % | |
4 | 100 % | |
3 | 0 % | |
2 | 0 % | |
1 | 0 % |
Avis clients
February 9, 2026
Price Change Bundle 1.0 BT delivers clear and practical price-change metrics. Best used on M10-H1, where momentum readings stay balanced and meaningful. Great for filtering weak moves, confirming impulse strength and improving intraday timing. A simple but effective companion for momentum-based strategies.
Discussion
Questions fréquentes
Prop
Forex
Signal
Breakout
Indices
Les produits disponibles sur cTrader Store, notamment les bots de trading, les indicateurs et les plug-ins, sont fournis par des développeurs tiers et mis à disposition à titre informatif et à des fins d'accès technique uniquement. cTrader Store n'est pas un courtier et ne fournit aucun conseil en investissement, aucune recommandation personnelle ni aucune garantie quant aux performances futures.


Prix
48
Ventes
1.06K
Installations gratuites