
Price Level DWM BT
Chỉ báo
Phiên bản 1.0, Dec 2025
Windows, Mac
4.7
Đánh giá: 4
Mô tả
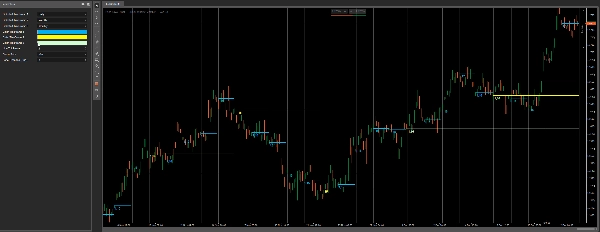
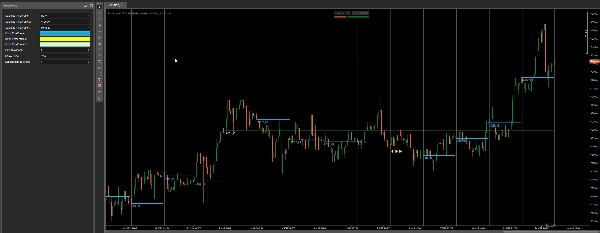
Mức giá DWM bởi Bullitt Traders
Mức giá DWM Biểu đồ các mức thay đổi giá Hàng ngày, Hàng tuần, Hàng tháng sạch sẽ, các mức tham chiếu khung thời gian cao hơn trực tiếp trên biểu đồ của bạn — để bạn luôn biết giá đang đứng ở đâu so với các mốc quan trọng Hàng ngày, Hàng tuần và Hàng tháng.
Các mức này được sử dụng rộng rãi cho:
- bối cảnh xu hướng & hướng đi
- phản ứng hỗ trợ/kháng cự trong ngày
- quyết định hồi quy trung bình so với tiếp tục xu hướng
- “giao dịch vị trí” (nơi giá đang giao dịch so với khung thời gian cao hơn)
Giữ cho biểu đồ của bạn tối giản, nhanh và dễ đọc trong khi vẫn có bối cảnh HTF trong tầm nhìn.
Bạn nhận được
- Tối đa 3 mức tham chiếu khung thời gian cao hơn cùng lúc
- Hàng ngày / Hàng tuần / Hàng tháng có thể chọn qua menu thả xuống
- Màu sắc riêng cho mỗi khung thời gian
- Độ dày có thể điều chỉnh
- Nhãn giá tùy chọn (sạch sẽ và không gây phiền)
Tính năng chính
- Vẽ mức HTF tối giản (thiết kế cho biểu đồ sạch)
- Mức tham chiếu không vẽ lại (dựa trên dữ liệu HTF đã hoàn thành)
- Hoạt động tốt với phiên giao dịch, vùng Cung & Cầu, cấu trúc thị trường, công cụ ICT và nhiều hơn nữa
- Phù hợp cho FX, chỉ số, vàng — bất kỳ thị trường nào
Cài đặt
- Chọn Khung Thời Gian 1 / 2 / 3
- Màu sắc cho mỗi khung thời gian
- Độ dày đường
- Hiển thị nhãn giá (bật/tắt)
- Khoảng cách nhãn (độ lệch trực quan)
Ghi chú
- Sử dụng dữ liệu khung thời gian cao hơn đã hoàn thành để giữ các mức ổn định và nhất quán.
Tóm tắt
Hồ sơ chỉ báo
Danh mục chỉ báo
Biến động
Loại đầu ra
Tín hiệu
Yêu cầu dữ liệu
Dữ liệu bên ngoài
Tín hiệu được hỗ trợ
Phá ngưỡng
Đánh giá của khách hàng
4.7
Đánh giá: 4
5 | 75 % | |
4 | 25 % | |
3 | 0 % | |
2 | 0 % | |
1 | 0 % |
Đánh giá của khách hàng
February 9, 2026
Price Level DWM BT provides clean and accurate daily, weekly and monthly levels. Best used from M5 and higher timeframes, where levels stay readable and meaningful. A great context tool for intraday and swing traders who rely on higher-TF structure, reactions and trade planning.
December 18, 2025
The setup needs less second guessing, but overconfidence is the real danger.
December 15, 2025
pretty fine as one more layer, especially in mixed charts. A few signals across sessions tell more.
Thảo luận
Câu hỏi thường gặp
Prop
Forex
Signal
Breakout
Scalping
Commodities
Crypto
Các sản phẩm có sẵn trên cTrader Store, bao gồm bot giao dịch, chỉ báo và plugin, được cung cấp bởi các nhà phát triển bên thứ ba và chỉ nhằm mục đích cung cấp thông tin và tiếp cận kỹ thuật. cTrader Store không phải là nhà môi giới và không cung cấp lời khuyên đầu tư, khuyến nghị cá nhân hay bất kỳ đảm bảo nào về hiệu suất trong tương lai.


Giá
48
Lượt bán
1.05K
Cài đặt miễn phí