
Volume Profile Pro
Chỉ báo
8 lượt mua
Phiên bản 1.0, Oct 2025
Windows, Mac
5.0
Đánh giá: 3
Mô tả
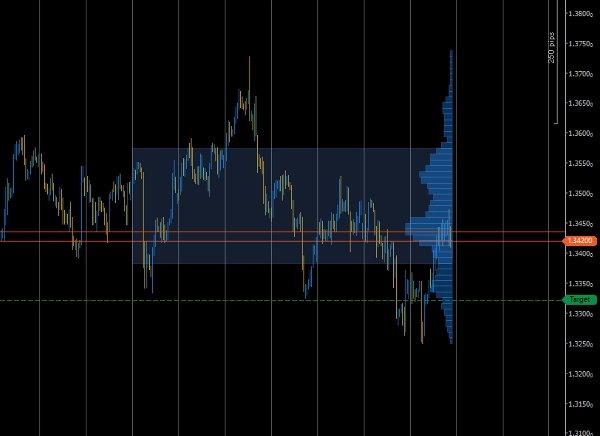
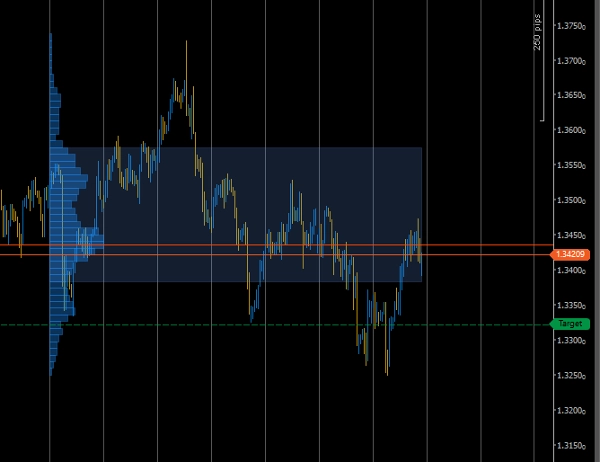
Volume Profile Pro là một công cụ phân tích khối lượng phạm vi cố định chuyên nghiệp được thiết kế để lập bản đồ cấu trúc thị trường và thanh khoản chính xác.
Nó cho phép bạn hình dung mức độ hoạt động giao dịch tại mỗi mức giá trong phạm vi biểu đồ đã xác định — giúp bạn nhanh chóng xác định các vùng quan tâm như các nút khối lượng cao, Điểm Kiểm Soát (POC) và Khu Vực Giá Trị 70%.
Tính Năng Chính
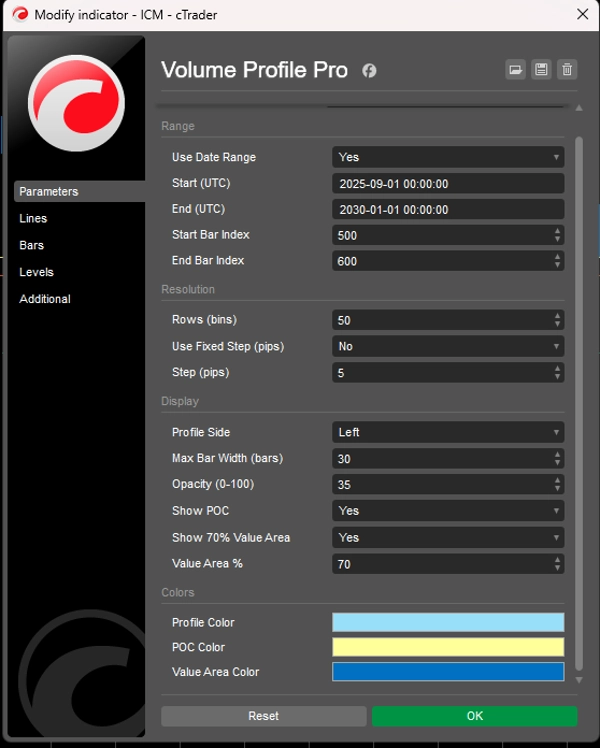
- 🧭 Chọn Phạm Vi Cố Định – Xác định phạm vi tùy chỉnh theo ngày hoặc chỉ số thanh để phân tích chỉ khu vực bạn quan tâm.
- 📊 Phân Bố Khối Lượng Chính Xác – Xây dựng biểu đồ khối lượng từ khối lượng tick trong phạm vi đã chọn.
- 🎯 POC & Khu Vực Giá Trị – Tự động làm nổi bật Điểm Kiểm Soát và dải khu vực giá trị 70%.
- ⚙️ Độ Phân Giải Linh Hoạt – Số lượng bin có thể điều chỉnh hoặc bước cố định theo pips để tùy chỉnh độ chi tiết.
- 🎨 Trực Quan Sạch Sẽ – Chọn bên (trái/phải), tỷ lệ chiều rộng và độ mờ để tối ưu khả năng đọc biểu đồ.
- ⚡ Nhẹ & Tối Ưu – Tính toán hiệu quả cho các nghiên cứu khối lượng thời gian thực mà không làm chậm thiết bị của bạn.
Cách Thức Hoạt Động
- Chọn sử dụng Phạm Vi Ngày hoặc Phạm Vi Chỉ Số Thanh.
- Xác định các tham số bắt đầu / kết thúc của bạn.
- Chỉ báo tính toán khối lượng tick tại mỗi bước giá và vẽ các thanh ngang thể hiện hoạt động tương đối.
- Thanh dài nhất đánh dấu POC, và vùng màu nhạt hiển thị Khu Vực Giá Trị (mặc định 70%).
Phù Hợp Cho
- Các nhà giao dịch trong ngày và giao dịch dao động phân tích sự tập trung thanh khoản.
- Nhà phát triển chiến lược dựa trên khối lượng tìm kiếm các vùng dựa trên dữ liệu.
- Các nhà giao dịch sử dụng các mức đảo chiều/hội tụ POC hoặc Khu Vực Giá Trị.
Tóm tắt
Tóm tắt AI
Volume Profile Pro is a fixed-range volume analysis indicator designed to visualize trading volume distribution by price within a user-defined chart range. It calculates tick volume at each price level and displays a horizontal histogram that highlights key market structure elements such as the Point of Control (POC)—the price with the highest traded volume—and the 70% Value Area, representing the price range where most trading activity occurred. Users can select the analysis range by date or bar index and adjust the resolution through customizable bin counts or fixed pip steps. The indicator offers flexible visualization options, including side placement, width scaling, and opacity adjustments, to enhance chart readability. Its efficient computation supports real-time volume studies without impacting terminal performance. Volume Profile Pro is suitable for intraday and swing traders, volume-based strategy developers, and those utilizing POC or Value Area levels for trading decisions. It supports multiple markets and symbols, including Forex pairs (EURUSD, GBPUSD, NZDUSD, USDJPY), cryptocurrencies (BTCUSD), commodities (XAUUSD), indices (NAS100), and stocks.
Hồ sơ chỉ báo
Đánh giá của khách hàng
5.0
Đánh giá: 3
5 | 100 % | |
4 | 0 % | |
3 | 0 % | |
2 | 0 % | |
1 | 0 % |
Đánh giá của khách hàng
October 20, 2025
Practical market note if the trader wants it adds useful information behind the price move. It works best as support, not a final decision maker. Volume context is stronger when POC, VWAP and value area agree across 2 sessions. volume alone can be noisy without price action.
October 19, 2025
October 19, 2025
Focused demo option for traders who want confirmation beyond candles. It gives value around volume based context, but volume alone can be noisy without price action. I would review 20 reactions near POC or VWAP before trusting the read. The data helps most when price action confirms the same zone.
Thảo luận
Câu hỏi thường gặp
BTCUSD
Prop
Forex
Indices
Commodities
Crypto
Stocks
Các sản phẩm có sẵn trên cTrader Store, bao gồm bot giao dịch, chỉ báo và plugin, được cung cấp bởi các nhà phát triển bên thứ ba và chỉ nhằm mục đích cung cấp thông tin và tiếp cận kỹ thuật. cTrader Store không phải là nhà môi giới và không cung cấp lời khuyên đầu tư, khuyến nghị cá nhân hay bất kỳ đảm bảo nào về hiệu suất trong tương lai.


Giá
Kể từ 31/10/2024
56
Lượt bán
1.75K
Cài đặt miễn phí