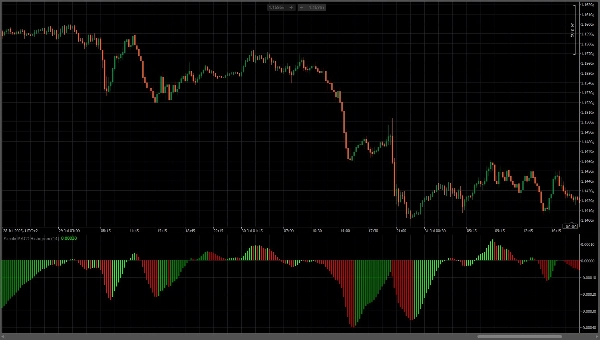
Courtiers & props
Pour entreprise
00
Days
:
00
Hours
:
00
Minutes
:
00
Seconds
Simple MACD Histogram
Logo de "Simple MACD Histogram"
Depuis le 15/06/2025
Installations gratuites
386
Image mise en ligne de "Simple MACD Histogram"

This custom MACD Histogram indicator displays the MACD histogram with enhanced visual clarity styling. The indicator uses a fast EMA period of 14, automatically calculates the slow EMA as fast plus 2 (16). The indicator features highly contrasted color-coding for instant trend recognition: bright green bars indicate rising momentum (bullish), while red bars show falling momentum (bearish). The histogram bars extend symmetrically from a center zero line, creating an intuitive visual representation where green signals buy pressure and red signals sell pressure. This visualization style provides clear, unambiguous momentum signals and helps identify potential trend reversals and momentum shifts in price action.

0.0
Avis : 0
Avis clients
Il n'y a pas encore d'avis sur ce produit. Vous l'avez déjà essayé ? Soyez le premier à en parler aux autres !
Plus de cet auteur
Flex VWAP
Flexible VWAP indicator with timezone-aware, custom time periods and automatic DST handling.
Vous pourriez aussi aimer
Indicateur
NAS100
NZDUSD
XAUUSD
+10
VMM Average Median
VMM Average Median - Advanced Median Indicator with Smart Trend Detection
Indicateur
NAS100
Indices
Prop
+3
session indicator
📈 Trading Sessions Indicator — London, New York & Tokyo Visualize Key Market Sessions + High/Low Levels with Precision
Price Speed or Acceleration v1
This Indicator will display either the speed or the acceleration of the current symbol.
Indicateur
Indices
RSI
StochasticRSI
Stochastic RSI (StochRSI) is a technical indicator used to measure the strength and weakness of the RSI.
Indicateur
NAS100
NZDUSD
Martingale
+26
Kalman Filter Trend
Smarter trend detection with zero unnecessary lag.
Indicateur
NAS100
XAUUSD
FVG
+6
Fair Value Gaps
The Fair Value Gap (FVG) Indicator identifies inefficiencies in price action where an imbalance occurs due to aggressive
Indicateur
RSI
XAUUSD
Breakout
+6
PREMIUM SSL CHANNEL
SSL Channel: Tracks trends 📈 measures volatility ⚡filters noise via ATR+SSL. Clear signals for precise entries/exit...
Zig zag v.1 Demo
ZigZag Pro DEMO – Multi-Swing Indicator for cTrader DEMO VERSION – 24 hours free trial! This is a DEMO version of the Z
Indicateur
RSI
Breakout
Supertrend
+3
Fibonacci Linear Regression Multi-timeframe
Combining Fibonacci levels and regression to analyze multidimensional market trends across multiple timeframes¡
Indicateur
Breakout
ORB v1.1
Opening Range Breakout v1.1 - Visuals + Stats
Dhruvin Wick Candelssss
RSI‑powered robot for high‑volatility scalping, no fuss.
Indicateur
Grid
NAS100
NZDUSD
+16
3D Normal Candles bY Mohammad KHR
3D candles for Normal OHLC candles.
Indicateur
NAS100
RSI
NZDUSD
+17
Nadaraya-Watson Indicator
Breakout Mode Patterns
Brooks price action breakout mode patterns
Pivot Points Clasic,FIBO,etc
All-in-one Pivot Indicator: set Classic, Fibo, Woodie, Camarilla, Demark methods, style levels & labels your way ;)
indicator
Multi-timeframe candlesticks!
Indicateur
Stocks
Forex
Crypto
Quantum Weighted Moving Average (QWMA)
Quantum Weighted Moving Average (QWMA): an advanced moving average that dynamically adjusts weights to market movement
Indicateur
Indices
Commodities
Forex
Institutional FVG Zones MTF with Confluence
Professional Fair Value Gaps with multitimeframe spot on