
Description
MoneyMasters - Indicateur HTF Bars
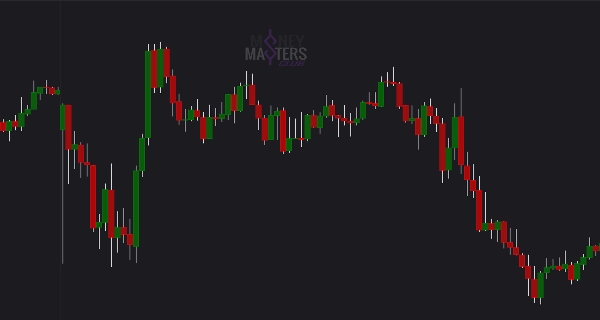
Améliorez votre expérience de trading avec le Indicateur MM-HTF Bars, un outil puissant conçu pour cTrader qui superpose parfaitement les données de chandeliers de timeframe supérieur (HTF) sur votre graphique actuel. Cet indicateur offre une représentation visuelle claire de l'action des prix HTF, vous aidant à prendre des décisions de trading plus éclairées en combinant plusieurs timeframes dans une seule vue.
Caractéristiques principales :
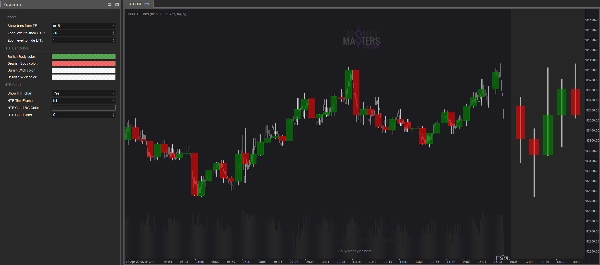
- Timeframe personnalisable : Choisissez le timeframe supérieur (par exemple, 15 minutes, 1 heure) à afficher directement sur votre graphique.
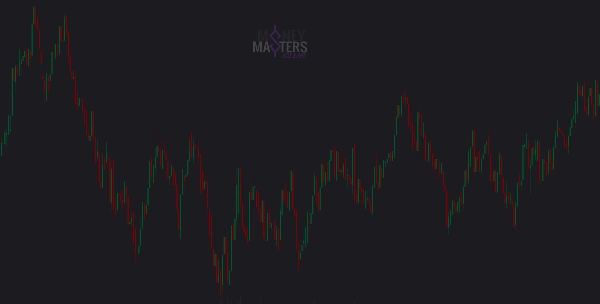
- Contrôle dynamique du zoom : Masquez ou affichez automatiquement les barres HTF et LTF en fonction du niveau de zoom de votre graphique pour une expérience sans encombrement.
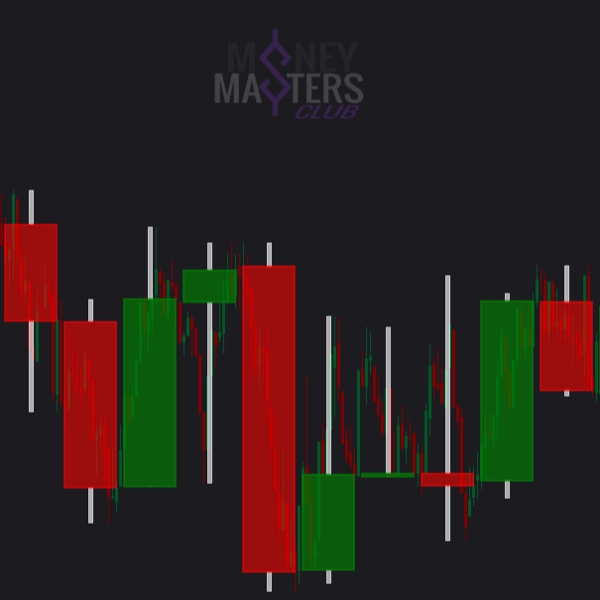
- Chandeliers codés par couleur : Distinguez facilement les chandeliers haussiers et baissiers HTF avec des couleurs personnalisables pour le corps et la mèche.
- Visualisation précise : Affiche les niveaux d'ouverture, haut, bas et clôture HTF avec un alignement précis sur la chronologie de votre graphique.
- Intégration transparente : Fonctionne en superposition, garantissant que votre graphique reste clair et facile à lire.
Avantages :
- Acquérez une compréhension plus approfondie des tendances du marché en analysant l'action des prix HTF aux côtés des données LTF.
- Améliorez votre stratégie de trading en identifiant les niveaux clés de support et de résistance HTF.
- Gagnez du temps et des efforts en éliminant le besoin de passer d'un graphique à un autre.
Que vous soyez scalpeur, trader journalier ou trader swing, le Indicateur MM-HTF Bars est un outil essentiel pour améliorer votre analyse de marché et votre processus de prise de décision.
Commencez à trader plus intelligemment dès aujourd'hui !
----------
Mise à jour 1.02 / 25041201 :
- MINI GRAPHIQUE HTF - affiche désormais un mini graphique sur le côté droit avec les chandeliers HTF. Vous pouvez choisir un TimeFrame différent et le nombre de chandeliers à afficher.
----------
Mise à jour 1.01 / 25040901 :
- Fonctionnement plus fluide - l'indicateur est maintenant mis à jour lors du changement de zoom, pas à chaque tick.
- L'indicateur peut changer les chandeliers en pause dans Market Reply.
Résumé
Avis clients
5 | 100 % | |
4 | 0 % | |
3 | 0 % | |
2 | 0 % | |
1 | 0 % |


![Logo de "High-Low Divergence [Iridio Capital]"](https://cdn.ctrader.com/image/webp/443c4661-7abb-40f1-842f-4b6ec560649b_40914)


