Mô tả
HỒ SƠ KHỐI LƯỢNG TỔ CHỨC - Công Cụ Phân Tích Thị Trường Nâng Cao
Khám phá nơi các nhà giao dịch tổ chức đang định vị bản thân với chỉ báo hồ sơ khối lượng chuyên nghiệp này. Khác với các công cụ khối lượng cơ bản, chỉ báo này tiết lộ cấu trúc thị trường thực sự bằng cách cho bạn thấy chính xác nơi diễn ra phần lớn hoạt động giao dịch.
TÍNH NĂNG CHÍNH:
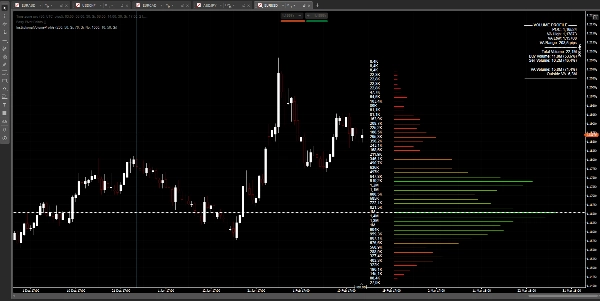
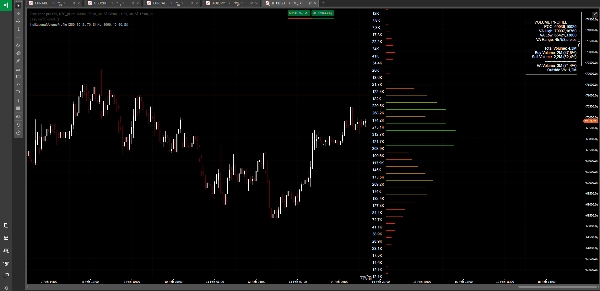
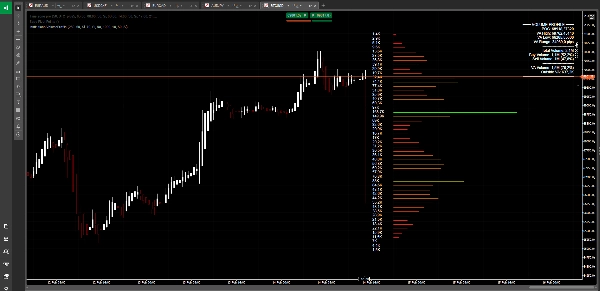
🎯 Điểm Kiểm Soát (POC)
Xác định ngay lập tức mức giá có khối lượng giao dịch cao nhất - điểm cân bằng của thị trường nơi hoạt động tổ chức tập trung.
📊 Phân Tích Khu Vực Giá Trị
Hình dung phạm vi giá chứa 70% tổng khối lượng giao dịch. Đây là nơi tồn tại "giá trị công bằng" và nơi giá có xu hướng hướng tới.
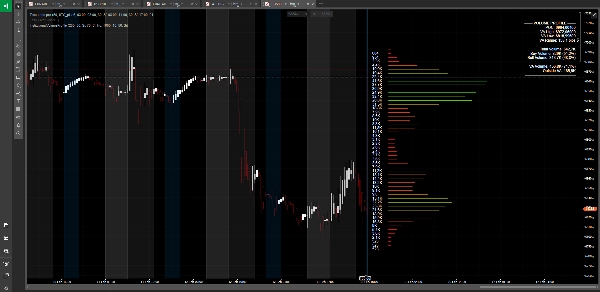
💹 Phân Tích Tâm Lý Mua/Bán
Xem sự cân bằng quyền lực giữa người mua và người bán với tỷ lệ phần trăm theo thời gian thực. Biết được phe bò hay phe gấu đang kiểm soát.
🎨 Gradient Màu Thông Minh
Các vùng khối lượng cao xuất hiện màu xanh lá sáng, trong khi các vùng khối lượng thấp hiển thị màu đỏ. Nhanh chóng nhận biết các vùng thanh khoản và khu vực có khả năng bứt phá.
📈 Trình Bày Chuyên Nghiệp
Hiển thị sạch sẽ, không gây cản trở với các thanh khối lượng kéo dài ra khỏi hành động giá. Các con số được đặt rõ ràng để dễ đọc ở mọi mức thu phóng.
⚙️ Hoàn Toàn Tùy Chỉnh
Điều chỉnh khoảng thời gian nhìn lại, số mức giá, màu sắc và các tùy chọn hiển thị để phù hợp với phong cách giao dịch của bạn.
PHÙ HỢP CHO:
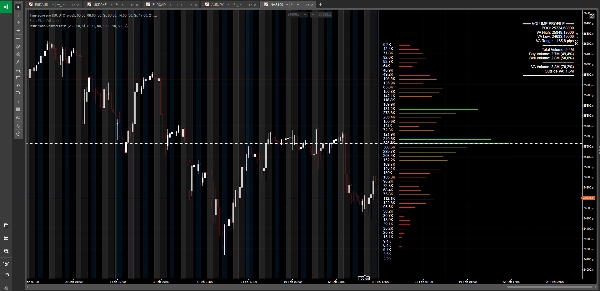
• Xác định các mức hỗ trợ và kháng cự chính
• Phát hiện các nút khối lượng thấp (LVN) cho các khả năng bứt phá
• Tìm các nút khối lượng cao (HVN) nơi giá có thể tích lũy
• Hiểu vị trí của các tổ chức
• Xác nhận điểm vào và ra lệnh giao dịch
• Phân tích đa khung thời gian
Dù bạn là nhà giao dịch trong ngày, giao dịch lướt sóng hay giao dịch vị thế, công cụ này giúp bạn có lợi thế bằng cách cho bạn thấy những gì các chỉ báo truyền thống không thể: nơi tiền thông minh đang hoạt động.
---
⚠️ CẢNH BÁO RỦI RO:
Giao dịch ngoại hối, tiền điện tử và các công cụ tài chính khác mang theo mức độ rủi ro cao và có thể không phù hợp với tất cả nhà đầu tư. Mức đòn bẩy cao có thể gây bất lợi cũng như có lợi cho bạn. Trước khi quyết định giao dịch, bạn nên cân nhắc kỹ các mục tiêu đầu tư, mức độ kinh nghiệm và khả năng chịu rủi ro của mình. Có khả năng bạn sẽ chịu mất một phần hoặc toàn bộ khoản đầu tư. Do đó, bạn không nên đầu tư số tiền mà bạn không thể chịu mất. Bạn nên nhận thức đầy đủ về tất cả các rủi ro liên quan đến giao dịch và tìm lời khuyên từ cố vấn tài chính độc lập nếu có bất kỳ nghi ngờ nào. Hiệu suất trong quá khứ không phải là chỉ báo cho kết quả trong tương lai.
Tóm tắt
- Point of Control (POC): Identifies the price level with the highest trading volume, indicating market equilibrium.
- Value Area Analysis: Displays the price range containing 70% of trading volume, representing the "fair value" zone.
- Buy/Sell Sentiment Analysis: Provides real-time percentage breakdowns of buying and selling pressure.
- Smart Color Gradient: Uses color coding to distinguish high-volume zones (bright green) from low-volume zones (red), aiding in spotting liquidity and breakout areas.
- Professional Presentation: Volume bars extend from price action with clear numeric labels, optimized for readability at any zoom level.
- Full Customization: Allows adjustment of lookback period, price levels, colors, and display settings.
This tool supports multi-timeframe analysis and is suitable for identifying key support/resistance levels, spotting low- and high-volume nodes, understanding institutional positioning, and confirming trade entries and exits. It is applicable across markets including Forex, indices, and symbols like XAUUSD and NAS100.
Đánh giá của khách hàng
5 | 33 % | |
4 | 33 % | |
3 | 0 % | |
2 | 33 % | |
1 | 0 % |