Mô tả
Độ mạnh cặp tiền (JPY) - Chỉ báo sức mạnh tiền tệ
📊 Độ mạnh cặp tiền (JPY) là gì?
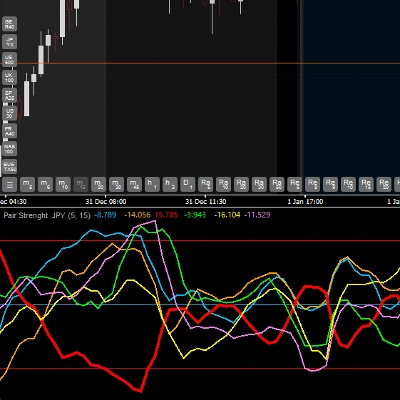
Độ mạnh cặp tiền (JPY) là một chỉ báo nâng cao phân tích và so sánh sức mạnh tương đối của 6 đồng tiền chính theo thời gian thực: EUR, GBP, JPY, USD, AUD và CAD. Nó sử dụng Chỉ số Sức mạnh Thực (TSI) để đo động lượng và sức mạnh của từng đồng tiền, giúp bạn xác định đồng tiền nào mạnh hơn hoặc yếu hơn trên thị trường.
🎯 Các tính năng chính
✅ Phân tích đa tiền tệ: Giám sát 6 đồng tiền cùng lúc trong một cửa sổ ✅ Nhận diện xu hướng: Phát hiện đồng tiền mạnh nhất và yếu nhất trên thị trường ✅ Tín hiệu mua quá bán quá: Các mức 50, 0 và -50 để xác định các vùng cực đoan ✅ Xác nhận giao dịch: Giúp xác thực các điểm vào lệnh bằng cách so sánh sức mạnh tương đối ✅ Trực quan và rõ ràng: Mỗi đồng tiền có màu riêng để dễ nhận biết
💹 Các cặp tương thích
QUAN TRỌNG: Chỉ báo này phân tích sức mạnh của 6 đồng tiền: EUR, GBP, JPY, USD, AUD và CAD
Chỉ báo hoạt động CHỈ với các cặp có chứa JPY (Yên Nhật), nghĩa là:
- EURJPY (Euro / Yên)
- GBPJPY (Bảng Anh / Yên)
- USDJPY (Đô la Mỹ / Yên)
- AUDJPY (Đô la Úc / Yên)
- CADJPY (Đô la Canada / Yên)
⚠️ Nhà môi giới của bạn PHẢI cung cấp 5 cặp này với JPY để chỉ báo hoạt động chính xác.
Không hoạt động với:
- Vàng, bạc hoặc các kim loại khác
- Chỉ số chứng khoán
- Tiền điện tử
- Các cặp không có JPY (như EURUSD, GBPUSD, v.v.)
Bạn có thể áp dụng chỉ báo trên biểu đồ của bất kỳ cặp nào trong 5 cặp đã nêu ở trên.
📈 Cách sử dụng chỉ báo
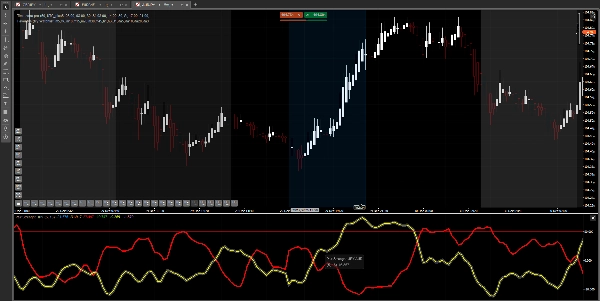
Giải thích đường:
Mỗi đường màu đại diện cho sức mạnh của một đồng tiền:
- Đường lên (giá trị dương): Đồng tiền MẠNH
- Đường xuống (giá trị âm): Đồng tiền YẾU
- Giao cắt đường: Thay đổi sức mạnh tương đối giữa các đồng tiền
Các mức chính:
- Mức 50: Vùng mua quá - Đồng tiền có thể rất mạnh và gần đảo chiều
- Mức 0: Đường trung lập - Cân bằng giữa sức mạnh và yếu
- Mức -50: Vùng bán quá - Đồng tiền có thể rất yếu và gần đảo chiều
Chiến lược cơ bản:
- Xác định đồng tiền MẠNH NHẤT (đường cao nhất)
- Xác định đồng tiền YẾU NHẤT (đường thấp nhất)
- Giao dịch cặp kết hợp cả hai (ví dụ: nếu EUR mạnh và JPY yếu → mua EURJPY)
- Xác nhận với các mức: Tránh mua khi đồng tiền mạnh ở +50 hoặc bán khi đồng tiền yếu ở -50
⚙️ Tham số điều chỉnh
- Chu kỳ nhanh (Mặc định: 5): Chu kỳ nhanh của TSI - giá trị thấp hơn = nhạy hơn
- Chu kỳ chậm (Mặc định: 15): Chu kỳ chậm của TSI - giá trị cao hơn = mượt hơn
Các giá trị mặc định hoạt động tốt trong hầu hết các tình huống. Điều chỉnh chúng theo phong cách giao dịch của bạn.
🔮 Cập nhật trong tương lai
Chúng tôi đang đánh giá khả năng thêm nhiều cặp tiền tệ hơn (NZD, CHF, v.v.) trong các phiên bản tương lai, tùy thuộc vào phản hồi và yêu cầu của người dùng. Tuy nhiên, điều này không được đảm bảo và sẽ phụ thuộc vào hiệu suất của chỉ báo và nhu cầu thị trường.
💡 Mẹo sử dụng
✓ Sử dụng kết hợp với chiến lược chính của bạn, không dùng làm hệ thống độc lập ✓ Kết hợp với phân tích hành động giá và các mức hỗ trợ/kháng cự ✓ Thực hành trước trên tài khoản demo trước khi giao dịch thật ✓ Không phải tất cả tín hiệu đều thắng - áp dụng quản lý rủi ro phù hợp ✓ Hoạt động tốt nhất trên khung thời gian M15 trở lên
📞 Hỗ trợ
Nếu bạn có câu hỏi về việc cài đặt hoặc sử dụng chỉ báo, hãy liên hệ với chúng tôi.
Lưu ý cuối cùng: Chỉ báo này là công cụ phân tích. Thành công trong giao dịch phụ thuộc vào nhiều yếu tố bao gồm quản lý rủi ro, tâm lý và kinh nghiệm.
Tóm tắt
This tool works exclusively with currency pairs that include the Japanese Yen (JPY), specifically EURJPY, GBPJPY, USDJPY, AUDJPY, and CADJPY. It does not support metals, stock indices, cryptocurrencies, or pairs without JPY. Users apply the indicator on any of the five JPY pairs to monitor multi-currency strength simultaneously in one window.
Adjustable parameters include the fast and slow periods of the TSI for sensitivity and smoothing. The indicator aids in trend identification, overbought/oversold signal detection, and trade confirmation by comparing relative currency strength. It is recommended for use alongside other analysis methods and on timeframes of 15 minutes or higher.
Đánh giá của khách hàng
5 | 100 % | |
4 | 0 % | |
3 | 0 % | |
2 | 0 % | |
1 | 0 % |


![Logo "[Stellar Strategies] Inside Bar with Signals"](https://cdn.ctrader.com/image/webp/1d9e8bfa-3b2c-4440-bb37-5856902008a7_30683)


