
Mô tả
🌐 THỐNG TRỊ THỊ TRƯỜNG VỚI ĐỌC DÒNG CHẢY TỔ CHỨC
Nó hiển thị: các giao dịch thực tế đã thực hiện — dòng chảy thực sự của sự hung hăng.
Ưu điểm: Chỉ báo này được đại diện bởi dữ liệu tick.
Đại diện cho số tiền đã được cam kết trên thị trường.
Phân loại những kẻ hung hăng (người mua/người bán chạm giá hỏi/giá đặt).
Phát hiện sự hấp thụ, kiệt sức, tăng tốc dòng chảy.
📈Kết hợp với các chỉ báo miễn phí, khối lượng theo giá, bộ nén khối lượng.
https://ctrader.com/products/2514 https://ctrader.com/products/2874
Dòng Lệnh
Đọc Băng Giao Dịch
Thang DOM
Hấp Thụ Tổ Chức
Phá Vỡ Thông Minh
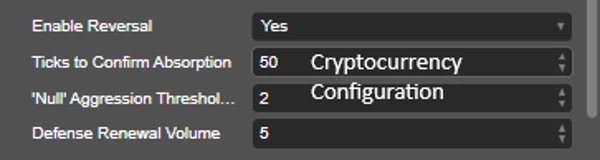
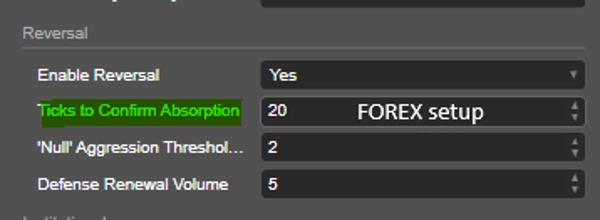
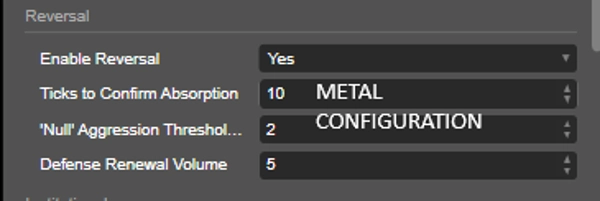
Đảo Chiều Dòng Chảy
Áp Lực Mua và Bán
Phân Tích Sự Hung Hăng Thời Gian Thực
Hệ thống biến đổi biểu đồ truyền thống thành trung tâm đọc thị trường tổ chức thực sự.
SỰ KHÁC BIỆT CỦA THUẬT TOÁN
Trong khi các chỉ báo thông thường chỉ phân tích nến, Tape Reading Scalper giải thích:
✅ Sự hung hăng thực sự từ người mua và người bán
✅ Tốc độ dòng chảy
✅ Phòng thủ tổ chức
✅ Hấp thụ lệnh
✅ Tăng tốc thang
✅ Phá vỡ được xác nhận bởi dòng chảy
✅ Đảo chiều do kiệt sức
✅ Áp lực tổ chức so với bán lẻ
✅ Tăng quy mô lô thông minh
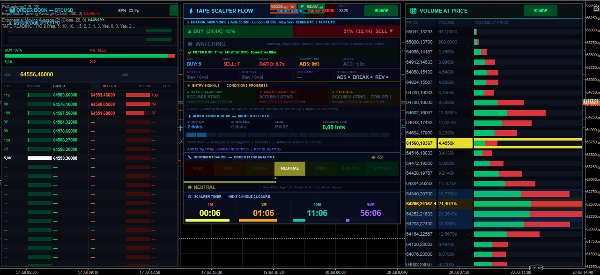
CẤU TRÚC HỆ THỐNG
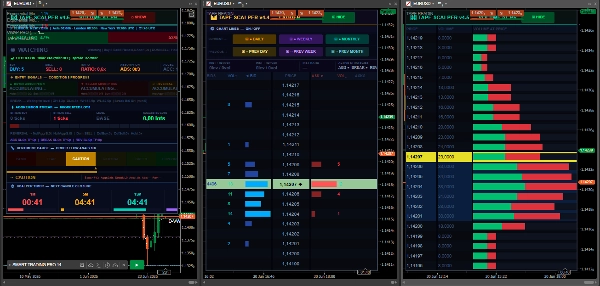
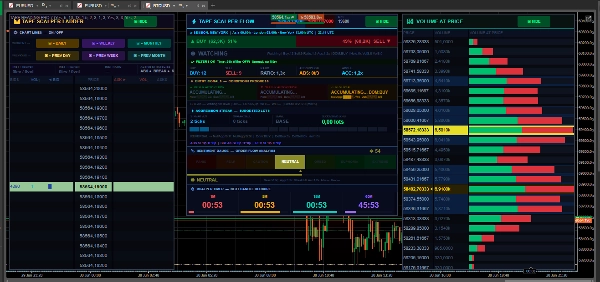
Thuật toán có 2 bảng điều khiển chuyên nghiệp độc lập:
⚡ BẢNG DÒNG CHẢY (CỬA SỔ 1)
Bảng chịu trách nhiệm đọc vận hành và tạo tín hiệu.
Hiển thị:
Dòng Người Mua/Người Bán
Hấp thụ
Đảo chiều
Phá vỡ
Chuỗi hung hăng
Phiên thị trường
Tỷ lệ Mua/Bán
Tăng tốc thang
SL/TP động
Bộ lọc vận hành
📊 BẢNG THANG (CỬA SỔ 2)
Bảng tổ chức tập trung vào:
Thang DOM
Mức tổ chức
Khối lượng theo giá
Áp lực tổ chức
POC
Phạm vi
Cao/Thấp hàng ngày và hàng tuần
Sổ giá
Nhiệt độ tổ chức
GIẢI THÍCH CHỨC NĂNG THANG
1. SỰ HUNG HĂNG MUA
Hiển thị sự hung hăng của người mua hiện tại.
Khi nó tăng nhanh:
Người mua đang vào mạnh. Thị trường có thể tăng tốc lên trên. Chỉ ra khả năng phá vỡ.
Số càng cao:
➡ áp lực mua càng lớn.
2. SỰ HUNG HĂNG BÁN
Hiển thị sự hung hăng của người bán.
Khi nó tăng nhanh:
Người bán đang chiếm ưu thế
Có thể tiếp tục giảm
Vào lệnh bán khống tổ chức
3. TỶ LỆ MUA/BÁN
Hiển thị mối quan hệ giữa người mua và người bán.
Ví dụ:
Tỷ lệ 2.0x = người mua chiếm ưu thế
Tỷ lệ 3.0x = áp lực tổ chức mạnh
Tỷ lệ dưới 1.0 = người bán chiếm ưu thế
Diễn giải:
Diễn giải tỷ lệ
1.0 Cân bằng
1.5 Áp lực vừa phải
2.0+ Xu hướng mạnh
3.0+ Dòng chảy tổ chức mạnh
4. HẤP THỤ
Một trong những chức năng mạnh mẽ nhất của thuật toán.
Hệ thống phát hiện khi:
Có khối lượng hung hăng lớn
Nhưng giá KHÔNG di chuyển
Điều này có nghĩa là:
➡ Nhà đầu tư tổ chức đang hấp thụ các lệnh.
HẤP THỤ NGƯỜI MUA
Thị trường nhận được nhiều lệnh bán, nhưng:
Giá ngừng giảm. Phòng thủ tổ chức xuất hiện. Có thể đảo chiều sang mua.
Tín hiệu:
▲ HẤP THỤ NGƯỜI MUA
HẤP THỤ NGƯỜI BÁN
Thị trường nhận được nhiều lệnh mua, nhưng:
Giá không tăng. Người bán kìm hãm chuyển động. Có thể đảo chiều sang bán.
Tín hiệu:
▼ HẤP THỤ NGƯỜI BÁN
5. TĂNG TỐC THANG
Đo tốc độ dòng chảy trong DOM.
Thuật toán so sánh:
Dòng chảy gần đây
so với Dòng chảy trước đó
Khi nó tăng tốc:
➡ Có khả năng vào lệnh tổ chức.
Ví dụ:
Giá trị Ý nghĩa
1.0x Dòng chảy bình thường
1.5x Tăng tốc mạnh
2.0x+ Bùng nổ tổ chức
6. PHÁT HIỆN PHÁ VỠ
Phát hiện các pha phá vỡ thực sự.
Hệ thống xác nhận:
✅ Khối lượng
✅ Sự hung hăng
✅ Tốc độ
✅ Chuỗi
✅ Dòng chảy tổ chức
✅ Tăng tốc thang
PHÁ VỠ MUA
Điều kiện:
Sự hung hăng mua mạnh Tăng tốc thang Áp lực tổ chức Phá vỡ đỉnh
Kết quả:
➡ Vào lệnh mua được xác nhận.
PHÁ VỠ BÁN
Điều kiện:
Áp lực bán mạnh Dòng chảy tổ chức bán Phá vỡ hỗ trợ
Kết quả:
➡ Bán được xác nhận.
7. PHÁT HIỆN ĐẢO CHIỀU
Phát hiện đảo chiều do kiệt sức.
Hệ thống nhận diện:
Sự hung hăng biến mất Phòng thủ tổ chức xuất hiện Mất sức mạnh xu hướng
Kết quả:
➡ Đảo chiều được dự báo trước.
8. HỆ THỐNG CHUỖI
Hệ thống liên tục dòng chảy thông minh.
Đếm số tick liên tiếp xảy ra:
Mua liên tục
hoặc
Bán liên tục
CẤP ĐỘ CHUỖI
Cấp độ Ý nghĩa
Cấp 1 Xu hướng ban đầu
Cấp 2 Dòng chảy mạnh
Cấp 3 Di chuyển bùng nổ
9. KÍCH THƯỚC LÔ ĐƯỢC ĐỀ XUẤT
Thuật toán tự động đề xuất:
tăng kích thước lô
giảm rủi ro
quy mô vận hành
Dựa trên:
✅ Sức mạnh dòng chảy
✅ Tính liên tục
✅ Cường độ tổ chức
11. POC (ĐIỂM KIỂM SOÁT)
Hiển thị giá có khối lượng giao dịch cao nhất.
Tầm quan trọng:
Hỗ trợ/kháng cự mạnh
Khu vực tổ chức
Khu vực phòng thủ
12. MỨC HÀNG NGÀY/HÀNG TUẦN
Các đường tự động cho:
Cao hàng ngày
Thấp hàng ngày
Cao hàng tuần
Thấp hàng tuần
Sử dụng cho:
✅ Phá vỡ
✅ Đảo chiều
✅ Thanh khoản
✅ Lệnh dừng lỗ
13. BỘ LỌC TỔ CHỨC
Bộ lọc tổ chức nâng cao.
Sự khác biệt:
Dòng chảy bán lẻ
so với Dòng chảy tổ chức
Hệ thống xác nhận:
✅ Cụm tổ chức
✅ Khối lượng theo mức
✅ Áp lực chiếm ưu thế
📈Sử dụng chỉ báo này như sự xác nhận cho việc vào lệnh trong chiến lược của bạn. Nên nhấn mạnh tầm quan trọng của việc phân tích dòng chảy, tín hiệu hấp thụ, tốc độ băng và sự hung hăng trong các tick, cũng như tâm lý thị trường.
Tóm tắt
Key functionalities include detection of institutional absorption (when large volume does not move price), breakout validation through volume and flow speed, reversal anticipation by exhaustion signals, and an intelligent streak system counting consecutive buy or sell ticks. The indicator also suggests lot sizing based on flow strength and institutional intensity, and applies an institutional filter distinguishing retail versus institutional flow.
Tape Reading 4.2 supports analysis of key market levels, real-time aggression, and flow reversals, transforming traditional charts into comprehensive institutional market reading tools. It is suitable for traders seeking detailed order flow insights and confirmation signals for entries based on market microstructure and volume dynamics.
Đánh giá của khách hàng
5 | 50 % | |
4 | 50 % | |
3 | 0 % | |
2 | 0 % | |
1 | 0 % |


