
Description
VolumeProfileSuite est un indicateur avancé et flexible de profil de volume pour cTrader.
Son objectif principal est d'analyser la distribution du volume (c'est-à-dire, où l'activité de trading a eu lieu) à différents niveaux de prix afin d'identifier les zones de "valeur" (volume élevé) et de "rejet" (volume faible). Cela vous aide à trouver les niveaux de support et de résistance les plus significatifs basés sur l'activité réelle du marché.
Sa caractéristique unique est qu'il combine deux modes d'analyse puissants en un seul outil, sélectionnable via le paramètre Profile Mode :
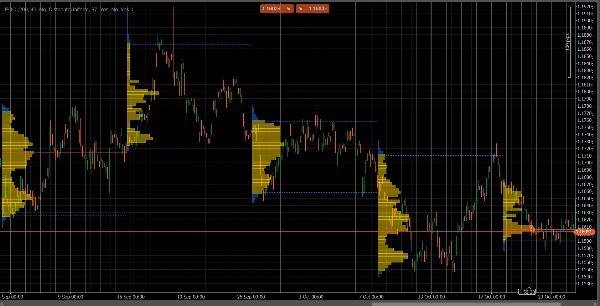
FixedRangeMode : Parfait pour l'analyse macro. Il vous permet d'analyser un seul grand bloc de votre choix (comme les 1000 dernières barres ou une plage de dates spécifique, par exemple, "toute la semaine dernière"). Il est idéal pour trouver les niveaux majeurs de support/résistance à long terme.PeriodicMode : Parfait pour l'analyse micro et comportementale. Il trace automatiquement un nouveau profil toutes les "N" barres (par exemple, toutes les 100 barres). Cela vous permet de voir comment le POC et la zone de valeur évoluent dans le temps et d'étudier les schémas répétitifs du marché.- Guide des paramètres (Anglais)
Voici le guide mis à jour pour votre nouvel indicateur unifié VolumeProfileSuite. Ce guide est crucial car il explique quels paramètres utiliser (et lesquels ignorer) selon le mode sélectionné.
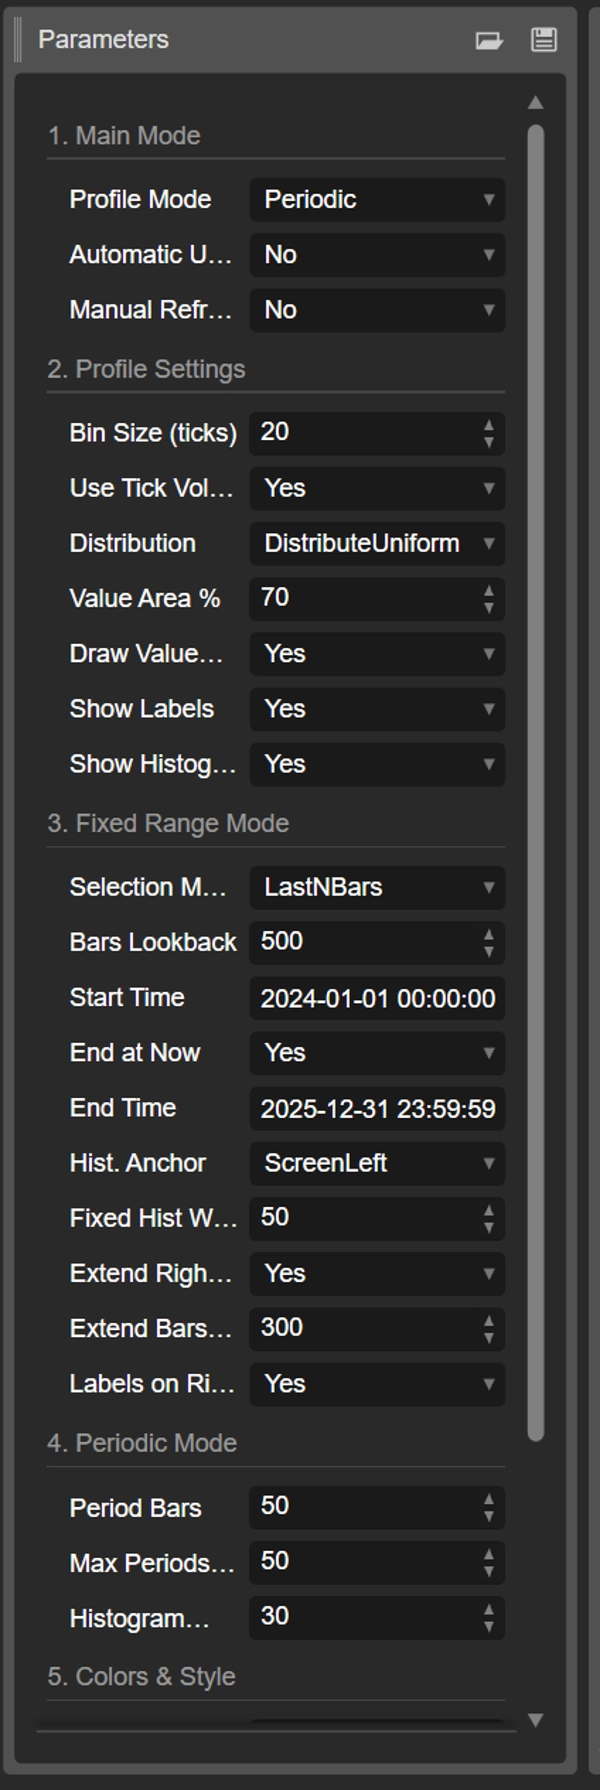
Groupe 1 : Mode principal
- Profile Mode : C'est le paramètre le plus important et agit comme l'interrupteur principal.
-
FixedRange: Active le mode "bloc unique". L'indicateur analysera un seul intervalle spécifié par vous (en utilisant les réglages du Groupe 3).Periodic: Active le mode "cyclique". L'indicateur analysera automatiquement tout le graphique en blocs (basé sur les réglages du Groupe 4).
IMPORTANT : En mode
FixedRange, vous devez ignorer tous les paramètres du "Groupe 4 : Mode Périodique". En modePeriodic, vous devez ignorer tous les paramètres du "Groupe 3 : Mode Plage Fixe".
Groupe 2 : Paramètres du profil
Ces paramètres sont communs et s'appliquent à les deux modes (FixedRange et Periodic).
- Taille du bin (ticks) : Contrôle la "résolution" verticale du profil. Une faible valeur (par exemple,
1) crée de nombreuses rangées de prix fines (très détaillé). Une valeur élevée (par exemple,10) regroupe les prix en rangées plus épaisses (moins détaillé, "plus lisse"). - Utiliser le volume Tick : Si
true(recommandé), le profil utilise le volume tick réel, qui est très précis. Sifalse, il compte simplement "1" pour chaque barre. - Distribution : Définit comment le volume d'une barre est distribué.
-
DistributeUniform(par défaut) : "Étale" le volume de la barre sur tous les niveaux de prix qu'elle a touchés, de son plus bas à son plus haut.CloseOnly: Attribue tout le volume de la barre uniquement à son prix de clôture.
- Pourcentage de la zone de valeur : Définit le pourcentage de volume qui constitue la "Zone de valeur" (la zone d'activité de trading la plus élevée). Une valeur de
70(70%) est la norme du marché. - Tracer la zone de valeur (VAH/VAL) : Si
true, trace les lignes horizontales pour le Haut de la zone de valeur (VAH) et le Bas de la zone de valeur (VAL). - Afficher les étiquettes : Si
true, affiche les étiquettes de texte ("POC", "VAH", "VAL"). (Attention : en modePeriodic, cela peut encombrer le graphique). - Afficher l'histogramme : Si
true, trace l'histogramme de volume (les barres horizontales).
Groupe 3 : Mode Plage Fixe
⚠️ Utilisez ces paramètres UNIQUEMENT si "Profile Mode" est réglé sur FixedRange.
- Mode de sélection : Choisit comment définir votre bloc unique.
-
DateRange: Utilise une date/heure de début et de fin spécifique.LastNBars: Utilise les N dernières barres.
- Retour en arrière des barres : (Pour
LastNBarsuniquement) Combien de barres en arrière analyser (par exemple,500). - Heure de début / Fin à maintenant / Heure de fin : (Pour
DateRangeuniquement) Définit le début et la fin de votre intervalle. - Ancre de l'histogramme : (Pour
FixedRangeuniquement) Définit où ancrer l'histogramme. -
DateRangeStart: Au début de votre intervalle (peut être hors écran).ScreenLeft: Au bord gauche de la fenêtre visible.ScreenRight: Au bord droit de la fenêtre visible (dans l'espace vide).
- Largeur fixe de l'histogramme (barres) : La largeur de l'histogramme (en barres) pour le mode
FixedRange. - Étendre uniquement à droite : Si
true, les lignes POC/VAH/VAL sont prolongées dans le futur. - Étendre les barres : (Seulement si
Extend Right Onlyesttrue) Combien de barres pour prolonger les lignes. - Étiquettes à droite : Si
true, place les étiquettes de prix à l'extrémité droite des lignes prolongées.
Groupe 4 : Mode Périodique
⚠️ Utilisez ces paramètres UNIQUEMENT si "Profile Mode" est réglé sur Periodic.
- Barres de période : C'est le paramètre clé pour ce mode. Il définit combien de barres inclure dans chaque bloc cyclique (par exemple,
100). - Nombre max de périodes à tracer : 🌟 PARAMÈTRE DE SÉCURITÉ ! Cela limite le nombre de profils cycliques tracés pour éviter que cTrader ne plante.
50signifie qu'il ne tracera que les 50 profils les plus récents, même si l'historique en contient plus. Ne réglez pas cette valeur trop haute (par exemple, > 200) ou cTrader pourrait se figer ! - Largeur de l'histogramme (barres) : La largeur de l'histogramme (en barres) pour chaque bloc cyclique.
Groupe 5 : Couleurs & Style
Ces paramètres sont communs et s'appliquent à les deux modes.
- Couleur POC : La couleur de la ligne du Point de Contrôle.
- Couleur VA : La couleur des lignes VAH et VAL.
- Épaisseur des lignes : L'épaisseur des lignes POC, VAH et VAL.
- Couleur de l'histogramme VA : La couleur des barres d'histogramme à l'intérieur de la zone de valeur (par défaut : Jaune).
- Couleur de l'histogramme extérieur : La couleur des barres d'histogramme à l'extérieur de la zone de valeur (par défaut : Bleu).
- Opacité de l'histogramme % : La transparence (opacité) de l'ensemble de l'histogramme.
Résumé
Avis clients
5 | 50 % | |
4 | 50 % | |
3 | 0 % | |
2 | 0 % | |
1 | 0 % |


