
Description
VERSION ÉTENDUE DISPONIBLE — ICI
Vous consultez actuellement la version originale. La version étendue de cet indicateur a été publiée avec des fonctionnalités supplémentaires :
- Affichage de l'âge amélioré : format années, mois, semaines, jours (par exemple, "3a 2s 4j")
- Afficher tous les FVG : Réglez "FVG à afficher" sur -1 pour afficher un nombre illimité de FVG historiques
- Étendre les FVG remplis : Option pour étendre les boîtes FVG remplies jusqu'à la barre actuelle
- Niveaux de Fibonacci : Niveaux automatiques (23,6 %, 38,2 %, 50 %, 61,8 %, 78,6 %) sur les FVG partiels et remplis
- Seuil de remplissage partiel : Seuil personnalisable (50-99 %, par défaut 90 %)
__________________________________________________________________________________________
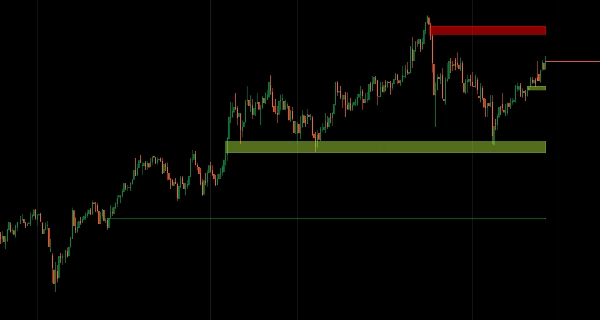
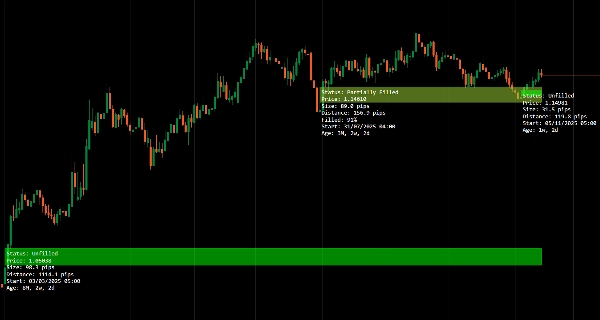
Identifiez les Fair Value Gaps avec suivi de l'âge et surveillance du statut de remplissage.
Détecte automatiquement les gaps haussiers et baissiers, suit leur comportement de remplissage (non rempli, partiellement, complètement rempli) en temps réel, et affiche l'âge du gap pour la priorisation.
Analyse multi-échelles pour aligner les gaps structurels HTF avec l'action des prix LTF, mises à jour dynamiques du statut lorsque le prix interagit avec les zones, et étiquetage minimal non intrusif pour une analyse ciblée du déséquilibre de liquidité pour les traders visant les remplissages de gaps et les entrées basées sur la structure.
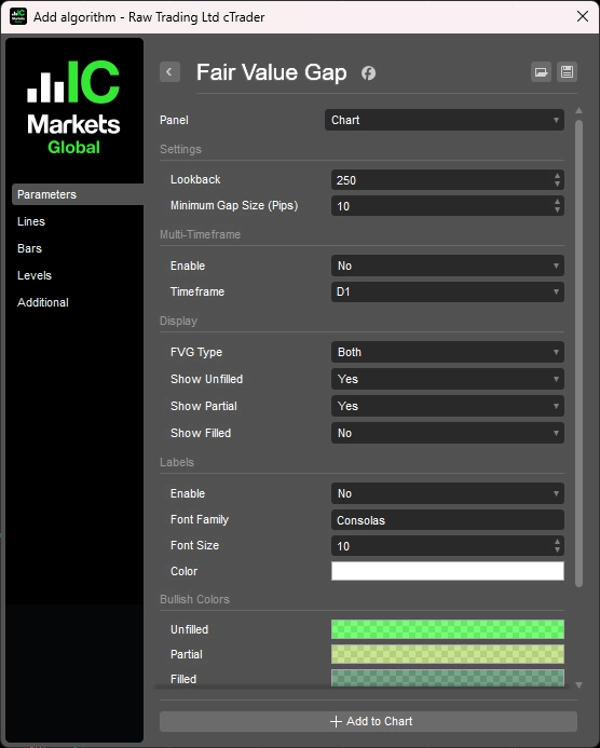
FONCTIONNALITÉS
Identification des FVG
- Détecte automatiquement les Fair Value Gaps haussiers et baissiers
- Suit en temps réel le statut non rempli, partiellement rempli et complètement rempli
- Représentation visuelle claire avec un encombrement minimal du graphique
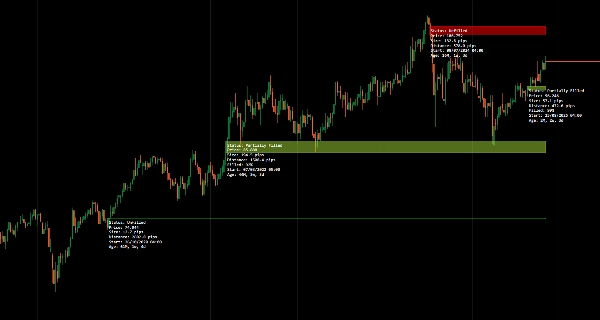
Étiquetage de l'âge
- Affiche le temps écoulé depuis la formation de chaque gap
- Aide à prioriser les gaps récents par rapport aux anciens pour la sélection des trades
- Le contexte temporel améliore la prise de décision sur la pertinence des gaps
Suivi du statut
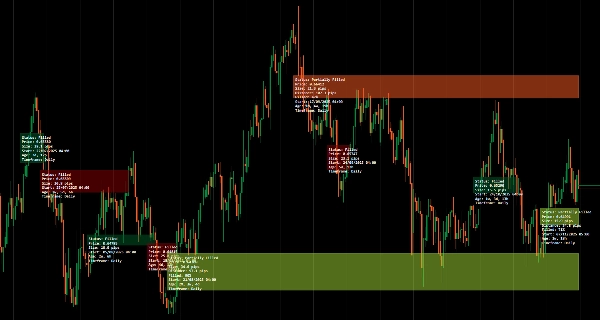
- Montre le statut actuel de remplissage : non rempli, partiellement rempli ou complètement rempli
- Mise à jour dynamique lorsque le prix interagit avec le gap
- Confirmation visuelle de la capture de liquidité
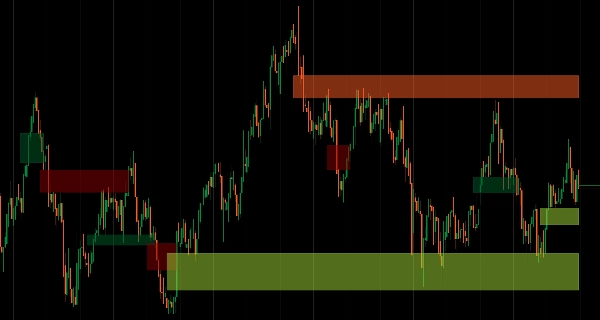
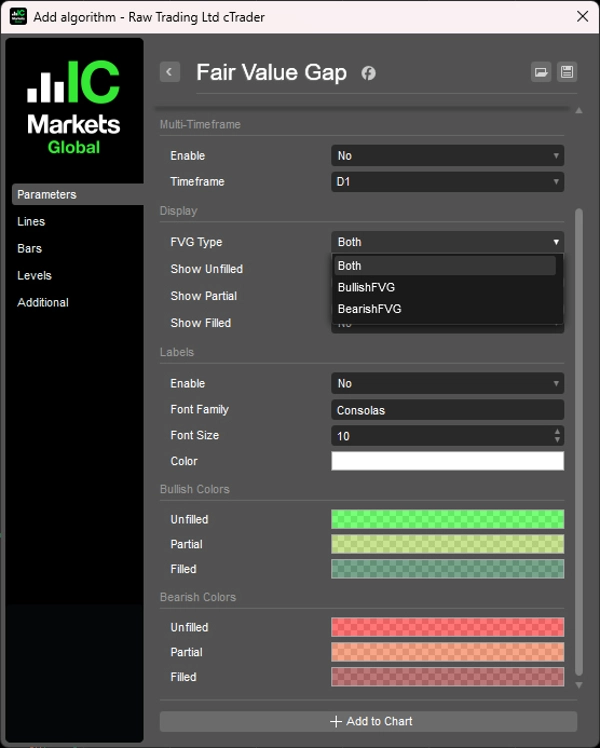
Mode multi-échelles
- Analyse et affiche les FVG des échelles supérieures sur les graphiques des échelles inférieures
- Aligne les gaps structurels HTF avec l'action des prix LTF
- Améliore le flux de travail d'analyse multi-échelles
Interface propre et minimaliste
- Étiquettes non intrusives conçues pour la clarté
- Informative sans encombrer votre vue des prix
- Présentation professionnelle pour une analyse ciblée
__________________________________________________________________________________________
PLUS D'INDICATEURS GRATUITS
Explorez une large gamme d'outils d'analyse de marché — de la structure et du volume à la régression, la volatilité et les périodes personnalisées.
Le code source est disponible sur le dépôt GitHub.
Tous gratuits à utiliser. Mais si vous souhaitez offrir un café en soutien, vous pouvez le faire ici.
Support/Résistance
Volume
- Profileur d'Activité de Volume
- Analyseur d'Efficacité du Volume
- Analyse du Profil de Volume
- Profil de Volume - Mis à jour
- Analyse de la Répartition du Volume
- VWAP (Prix Moyen Pondéré par le Volume)
Moyennes Mobiles
- Moyenne Mobile Ancrée
- Moyenne Mobile Échelonnée par Déviation
- Ligne de Tendance Instantanée
- MA Adaptative de Kaufman avec Vision de Tendance
- Canal de Moyenne Mobile
- Suite de Moyennes Mobiles
- Moyenne Mobile du Canal de Tendance
Utilitaires/Personnalisé
Basé sur la Régression
Volatilité
Oscillateurs
__________________________________________________________________________________________
AVERTISSEMENT
Le trading comporte des risques. Cet indicateur est destiné uniquement à l'analyse technique — appliquez toujours une gestion appropriée des risques et tradez de manière responsable.
RETROACTION & AMÉLIORATIONS
Si vous avez des suggestions, des demandes de fonctionnalités ou des idées d'amélioration, veuillez laisser un commentaire dans l'onglet Discussion. Vos retours aident à améliorer l'indicateur pour tous.
Résumé
Avis clients
5 | 100 % | |
4 | 0 % | |
3 | 0 % | |
2 | 0 % | |
1 | 0 % |


