
Description
APERÇU
L'indicateur Balance of Power mesure la force des acheteurs par rapport aux vendeurs en évaluant la capacité de chaque camp à pousser les prix à des niveaux extrêmes.
Introduit par Igor Levshin dans le numéro d'août 2001 de Technical Analysis of Stocks & Commodities, BOP calcule le ratio du mouvement des prix dans la plage de chaque barre pour révéler la dynamique de la force interne indépendamment de la direction du prix.
CONCEPT
Balance of Power mesure où le prix se clôture dans la plage de chaque barre pour révéler la bataille interne entre acheteurs et vendeurs.
Le principe sous-jacent est simple : les acheteurs poussent les prix vers le haut, les vendeurs vers le bas. L’endroit où le prix se clôture finalement dans cette plage révèle qui a dominé la période de trading.
Les valeurs brutes sont lissées à l’aide d’une moyenne mobile pour réduire le bruit et révéler une pression directionnelle soutenue, transformant des lectures erratiques barre par barre en un indicateur de momentum clair qui suit les changements de contrôle du marché.
APPLICATION À LA STRUCTURE DU MARCHÉ
BOP fournit une analyse de la force interne qui peut confirmer ou contredire la structure des prix :
Identification de la phase de tendance
- Forte tendance haussière : BOP constamment au-dessus de zéro avec des creux plus hauts
- Forte tendance baissière : BOP constamment en dessous de zéro avec des sommets plus bas
- Consolidation : BOP oscillant autour de la ligne zéro
- Zones de transition : BOP rompant la structure précédente (plus haut plus haut / plus bas plus bas)
Confluence Support/Résistance
- Le retour de BOP à zéro coïncide souvent avec le test des niveaux clés par le prix
- Les lectures extrêmes de BOP (+0,8 à +1,0 ou -0,8 à -1,0) peuvent indiquer une exhaustion près de la structure
- La divergence aux niveaux de structure suggère un rejet potentiel ou une percée
Distribution/Accumulation
- Prix en hausse avec BOP en baisse : phase de distribution potentielle
- Prix en baisse avec BOP en hausse : phase d’accumulation potentielle
- Ces divergences sont les plus significatives près des niveaux de structure majeurs
STRATÉGIE MULTI-TIMEFRAME
Utiliser BOP sur plusieurs échelles de temps apporte contexte et précision :
1. Échelle de temps supérieure (HTF) - Biais directionnel :
- BOP quotidien/4H au-dessus de zéro → chercher des opportunités d’achat sur des échelles inférieures
- BOP quotidien/4H en dessous de zéro → chercher des opportunités de vente sur des échelles inférieures
- BOP HTF traversant zéro → changement majeur de tendance, attendre confirmation
2. Échelle de temps inférieure (LTF) - Timing d’entrée :
- BOP 1H/15M aligné avec HTF → configurations à haute probabilité
- Croisement BOP/Signal LTF dans la direction HTF → déclencheur d’entrée
- Expansion de l’histogramme LTF confirme le momentum
3. Alignement des échelles de temps :
- Toutes les échelles de temps en accord → trades avec la conviction la plus forte
- HTF et LTF divergents → attendre résolution ou éviter le trade
- Renversement LTF contre HTF → scalp potentiel uniquement contre-tendance
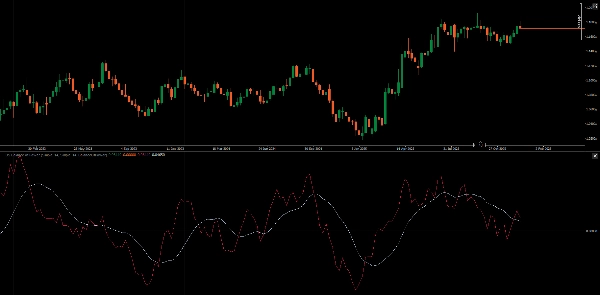
LIGNE DE SIGNAL & HISTOGRAMME
Ligne de signal (MA de BOP) :
- Les croisements BOP/Signal fournissent des signaux d’entrée/sortie filtrés
- La pente de la ligne de signal indique la persistance du momentum
- La distance entre BOP et Signal montre l’extension du mouvement
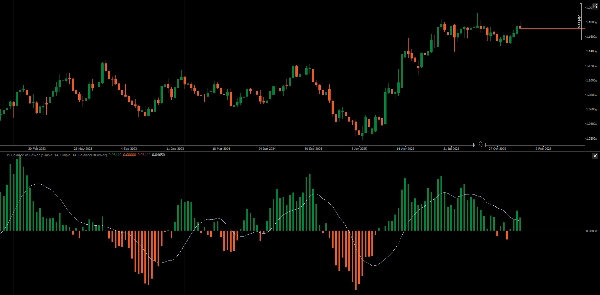
Modes d’histogramme :
- Mode Valeur : Montre la polarité de BOP par rapport à zéro (domination acheteur/vendeur)
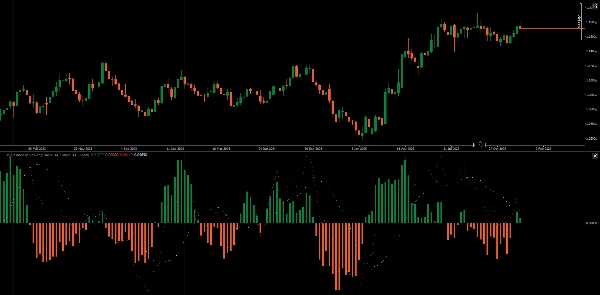
- Mode Signal : Montre la différence BOP - Signal, révélant les changements de momentum plus tôt que les croisements
En mode Signal, les croisements de la ligne zéro de l’histogramme se produisent avant les croisements BOP/Signal, offrant un avertissement précoce du changement de momentum.
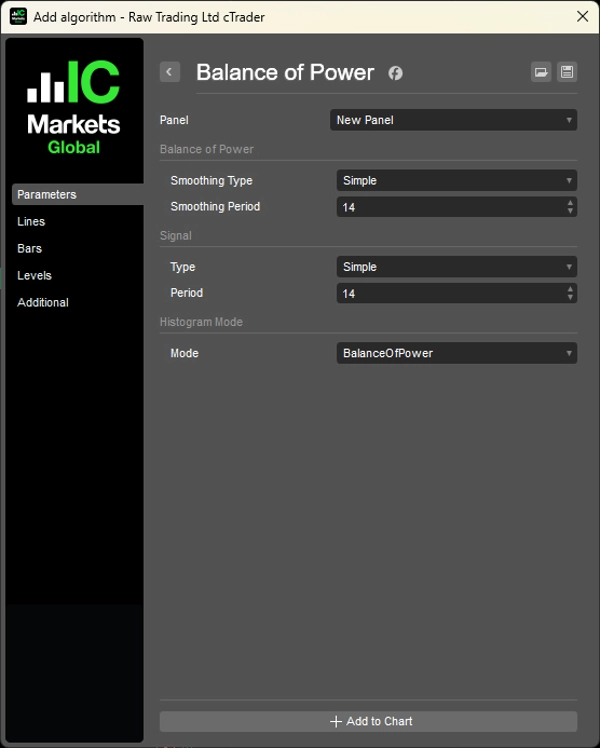
CARACTÉRISTIQUES
- Période de lissage : période MA ajustable pour BOP (par défaut 14)
- Type de lissage : choix des types de MA (SMA, EMA, etc.)
- Période de signal : période MA ajustable pour la ligne de signal (par défaut 14)
- Type de signal : choix des types de MA pour la ligne de signal
- Mode histogramme : bascule entre l’affichage de la valeur et de la différence de signal
EXEMPLE PRATIQUE
- HTF (quotidien) : BOP au-dessus de zéro et en hausse → biais haussier
- Le prix revient vers un support
- LTF (1H) : BOP croise au-dessus du Signal → déclencheur d’entrée
- Histogramme (mode Signal) s’étend → confirme l’accélération du momentum
- Sortie lorsque l’histogramme LTF se contracte ou que BOP croise en dessous du Signal
__________________________________________________________________________________________
PLUS D’INDICATEURS GRATUITS
Explorez une large gamme d’outils d’analyse de marché — de la structure et du volume à la régression, la volatilité et les échelles de temps personnalisées.
Le code source est disponible sur le dépôt GitHub.
Tous gratuits à utiliser. Mais si vous souhaitez offrir un café en soutien, vous pouvez le faire ici.
Support/Résistance
Volume
- Volume Activity Profiler
- Volume Efficiency Analyzer
- Volume Profile Analytics
- Volume Profile - Updated
- Volume Spread Analysis
- VWAP (Volume Weighted Average Price)
Moyennes Mobiles
- SSL Channel
- Anchored Moving Average
- Deviation-Scaled Moving Average
- Gann High Low Activator
- Instantaneous Trendline
- Kaufman Adaptive MA with Trend Vision
- Moving Average Channel
- Moving Averages Suite
- Trend Channel Moving Average
Utilitaires/Personnalisés
Basé sur la Régression
Volatilité
Oscillateurs
__________________________________________________________________________________________
AVERTISSEMENT
Le trading comporte des risques. Cet indicateur est destiné uniquement à l’analyse technique — appliquez toujours une gestion des risques appropriée et tradez de manière responsable.
RETROACTION & AMÉLIORATIONS
Si vous avez des suggestions, des demandes de fonctionnalités ou des idées d’amélioration, veuillez laisser un commentaire dans l’onglet Discussion. Vos retours aident à améliorer l’indicateur pour tous.
Résumé
Key functionalities include identifying trend phases—strong uptrends, downtrends, consolidation, and transition zones—by observing BOP behavior relative to the zero line. It also aids in detecting support and resistance confluence, with extreme BOP readings indicating potential exhaustion near key levels and divergences signaling possible rejections or breakthroughs. The indicator helps identify distribution and accumulation phases through price and BOP divergences.
BOP supports multi-timeframe analysis: higher timeframes provide directional bias, while lower timeframes offer entry timing signals via BOP and signal line crossovers and histogram momentum confirmation. The signal line is a moving average of BOP, with crossovers serving as filtered entry/exit triggers. The histogram can display either BOP polarity or the difference between BOP and its signal line, offering early momentum shift warnings.
Adjustable parameters include smoothing periods and types for both BOP and signal lines, and histogram display modes. The indicator is applicable across Forex, indices, commodities, cryptocurrencies, and stocks markets.


