
Описание
ОБЗОР
Instantaneous Trendline — это технический индикатор, разработанный Джоном Эллерсом, инженером-электриком, который применил принципы цифровой обработки сигналов (DSP) к анализу финансовых рынков. Изначально опубликованный в журнале Stocks & Commodities (февраль 2002 года) и подробно описанный в его книгах "Rocket Science for Traders" и "Cybernetic Analysis for Stocks and Futures", этот индикатор выделяет трендовую составляющую ценовых данных, фильтруя циклические (осциллирующие) компоненты.
КОНЦЕПЦИЯ
В отличие от традиционных скользящих средних, которые просто сглаживают ценовые данные, Instantaneous Trendline использует математические методы, заимствованные из электротехники, для разложения ценового движения на два отдельных компонента:
- Трендовая составляющая - Направленная тенденция рынка
- Циклическая составляющая - Осциллирующие колебания вокруг тренда
Применяя режекторные фильтры и методологию преобразования Гильберта, Эллерс создал индикатор, который быстро реагирует на реальные изменения тренда, одновременно фильтруя шум и краткосрочные циклы. В результате получается трендовая линия, которая адаптируется к рыночным условиям с значительно меньшей задержкой по сравнению с простыми или экспоненциальными скользящими средними аналогичных периодов.
Основное преимущество этого подхода — математическая точность в отделении того, что является «трендом», от того, что является «циклическим шумом», а не просто усреднение цены за фиксированный период.
ПРИНЦИП РАБОТЫ
Индикатор вычисляет сглаженную трендовую линию с помощью рекурсивной формулы, основанной на параметре Alpha. Формула включает:
- Текущие и недавние ценовые данные (средняя точка HL/2)
- Предыдущие значения трендовой линии
- Коэффициент сглаживания Alpha (по умолчанию 0.07)
Индикатор также генерирует линию Trigger, которая представляет собой Instantaneous Trendline, смещённую на 2 бара. Эта линия Trigger используется для генерации торговых сигналов через логику пересечения.
ИНТЕРПРЕТАЦИЯ
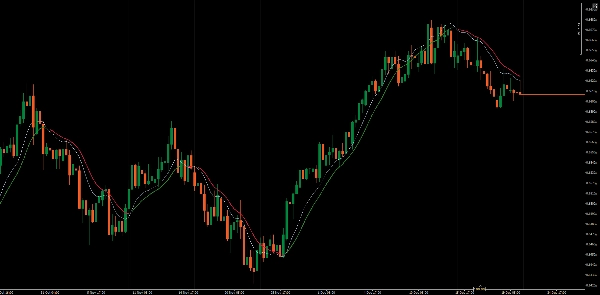
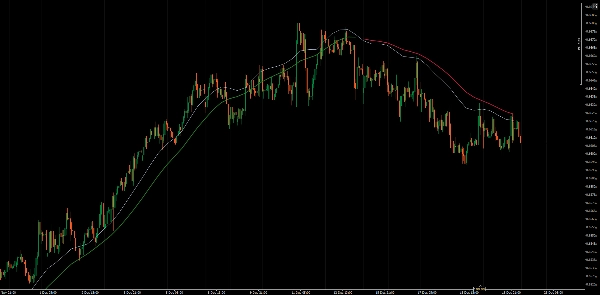
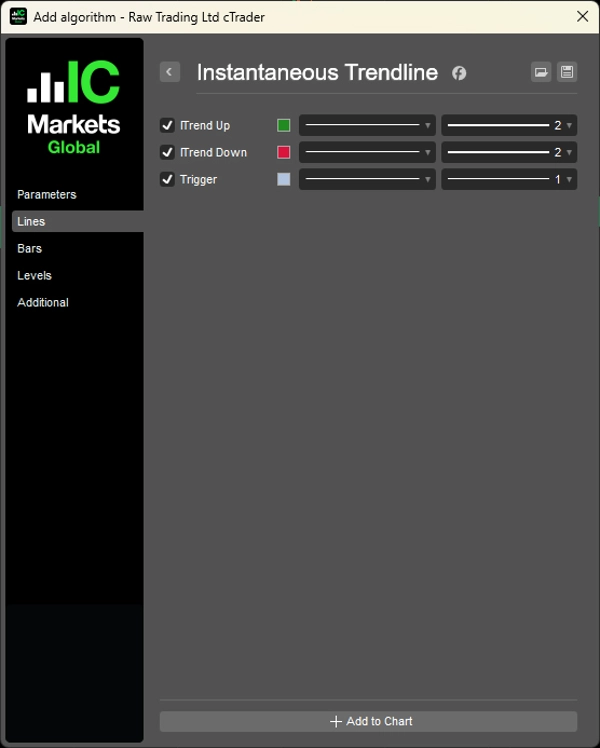
Индикатор отображает три линии:
- ITrend Вверх: Отображается, когда Trigger > ITrend, указывая на бычьи условия
- ITrend Вниз: Отображается, когда Trigger < ITrend, указывая на медвежьи условия
- Trigger: Версия трендовой линии с задержкой в 2 бара
Генерация сигналов:
- Бычий сигнал: Когда линия Trigger пересекает Instantaneous Trendline снизу вверх
- Медвежий сигнал: Когда линия Trigger пересекает Instantaneous Trendline сверху вниз
Цветовая кодировка облегчает быстрое определение текущего направления тренда.
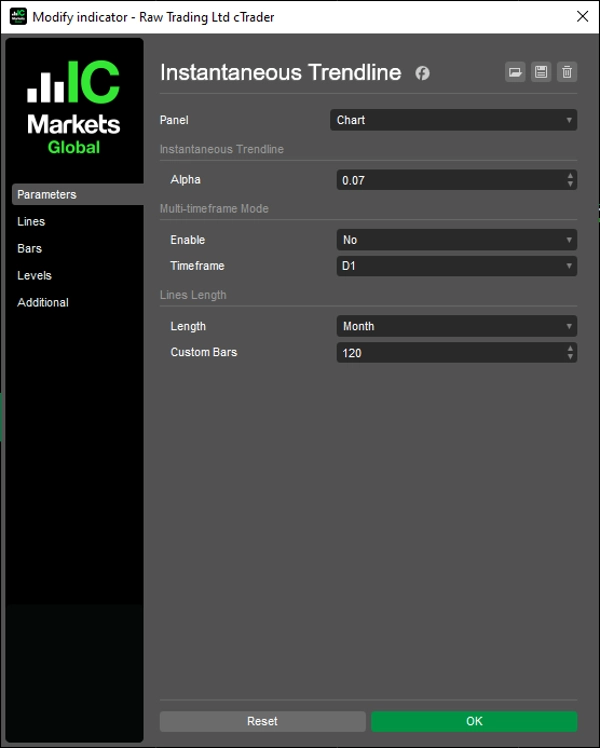
КЛЮЧЕВЫЕ ПАРАМЕТРЫ
Alpha (0.01 - 1.0, по умолчанию 0.07)
Контролирует сглаживание и чувствительность трендовой линии. Более низкие значения дают более гладкие, медленнее реагирующие линии, подходящие для долгосрочных трендов. Более высокие значения увеличивают чувствительность к изменениям цены, но могут создавать больше ложных сигналов на флетовом рынке. Значение по умолчанию 0.07 обеспечивает баланс между отзывчивостью и фильтрацией шума.
Длина линий (по умолчанию 120)
Определяет, сколько баров исторических данных трендовой линии отображается на графике. Это помогает сохранить график чистым, при этом обеспечивая достаточный контекст.
ОГРАНИЧЕНИЯ
- Как и все инструменты, следующие за трендом, Instantaneous Trendline может давать ложные сигналы (whipsaws) на боковых, флетовых рынках
- Во время сильных трендов индикатор может удерживать вас в позиции дольше, но вы можете пропустить точные вершины или основания
- Эффективность значительно варьируется в зависимости от рыночных условий (трендовые против флетовых)
- Индикатор реактивен, а не предсказателен — он выявляет тренды после их начала
__________________________________________________________________________________________
БОЛЬШЕ БЕСПЛАТНЫХ ИНДИКАТОРОВ
Изучите широкий спектр инструментов анализа рынка — от структуры и объема до регрессии, волатильности и пользовательских таймфреймов.
Исходный код доступен в репозитории GitHub repository.
Все бесплатно для использования. Но если хотите поддержать автора кофе, можете сделать это здесь.
Поддержка/Сопротивление
Объем
- Volume Activity Profiler
- Volume Efficiency Analyzer
- Volume Profile Analytics
- Volume Profile - Updated
- Volume Spread Analysis
- VWAP (Volume Weighted Average Price)
Скользящие средние
- SSL Channel
- Anchored Moving Average
- Deviation-Scaled Moving Average
- Gann High Low Activator
- Instantaneous Trendline
- Kaufman Adaptive MA with Trend Vision
- Moving Average Channel
- Moving Averages Suite
- Trend Channel Moving Average
Утилиты/Пользовательские
Регрессия
Волатильность
Осцилляторы
__________________________________________________________________________________________
ОТКАЗ ОТ ОТВЕТСТВЕННОСТИ
Торговля связана с риском. Этот индикатор предназначен только для технического анализа — всегда применяйте надлежащее управление рисками и торгуйте ответственно.
ОБРАТНАЯ СВЯЗЬ И УЛУЧШЕНИЯ
Если у вас есть предложения, запросы на функции или идеи по улучшению, пожалуйста, оставьте комментарий во вкладке Обсуждение. Ваш отзыв помогает улучшить индикатор для всех.
Сводка
Отзывы покупателей
5 | 100 % | |
4 | 0 % | |
3 | 0 % | |
2 | 0 % | |
1 | 0 % |


