Описание
Трёхцветная адаптивная система каналов с использованием скользящих средних по всем четырём ценам OHLC для анализа направления тренда и структуры.
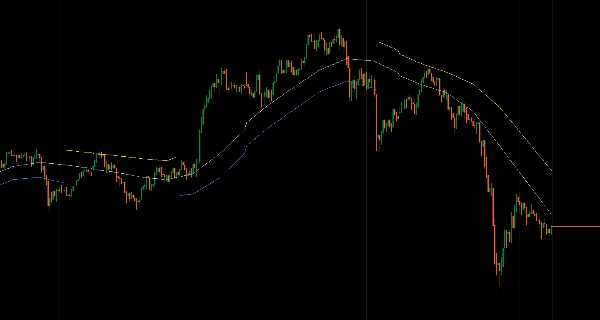
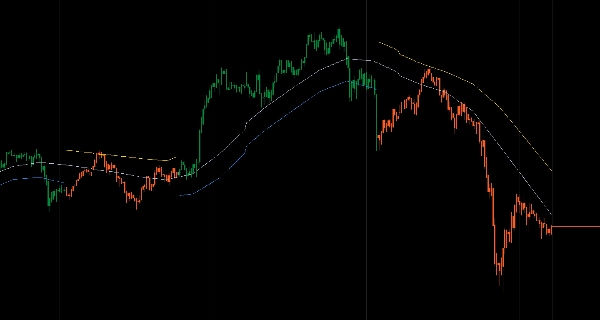
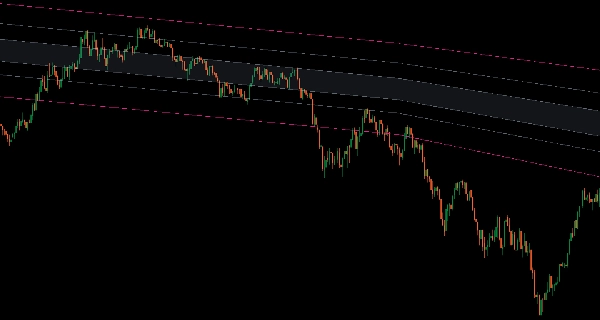
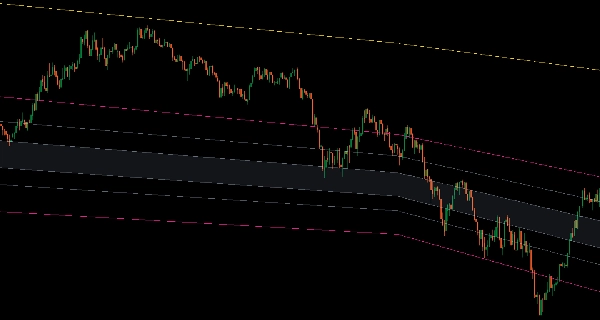
Отображает границы High/Low, линии направленного смещения Open/Close и медиану равновесия с цветовой кодировкой состояний тренда (синий — восходящий тренд, золотой — нисходящий тренд, серый — нейтральный), которые адаптируются вместе.
Два режима отображения (полный канал или уменьшение визуального шума на основе тренда), шесть опциональных зон Фибоначчи (полные откаты канала, уровни половины канала, расширения прорыва), 15 алгоритмов скользящих средних (Arnaud Legoux, Jurik, Hull, KAMA, VIDYA, Deviation Scaled, SuperSmoother, Ultimate Smoother, McGinley Dynamic, T3, ZLEMA, Laguerre), интерполяция по нескольким таймфреймам, вычисление якорной даты для периодов роста на основе событий и окраска баров по тренду обеспечивают согласованную структуру канала для трейдеров, ориентированных на откаты и возврат к среднему в пределах заданных границ.
ОСОБЕННОСТИ
Трёхцветная система тренда
- Синие линии: подтверждённый восходящий тренд — торгуйте откаты к нижней линии
- Золотые линии: подтверждённый нисходящий тренд — торгуйте отскоки к верхней линии
- Серые линии: нейтральный/флэт — избегайте экстремумов, скальпируйте середину
- Все линии адаптируются вместе — без смешанных сигналов
Полная структура канала
- Линии High/Low определяют границы канала
- Линии Open/Close показывают направленное смещение внутри канала
- Медианная линия (центр всех четырёх) обозначает истинное равновесие
- Интегрированная структура, которая движется согласованно
Два режима отображения
- Режим канала: всегда показывать обе границы с цветами тренда
- Режим на основе тренда: скрывать верхнюю линию при восходящих трендах, нижнюю при нисходящих — уменьшает визуальный шум, сохраняет фокус на торгуемой границе
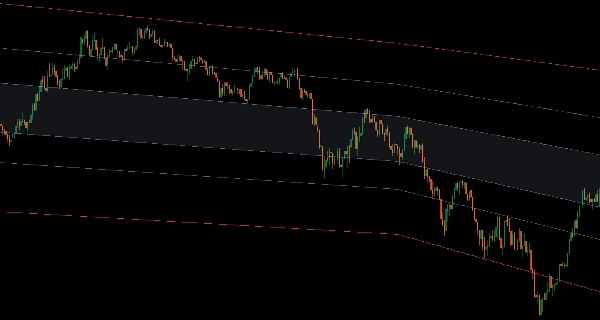
6 зон Фибоначчи (опционально)
- Между Low и High (полные откаты канала)
- Между Low и Median или Median и High (уровни половины канала)
- Верхние/нижние расширения (цели прорыва)
- Общий диапазон (от нижнего до верхнего расширения)
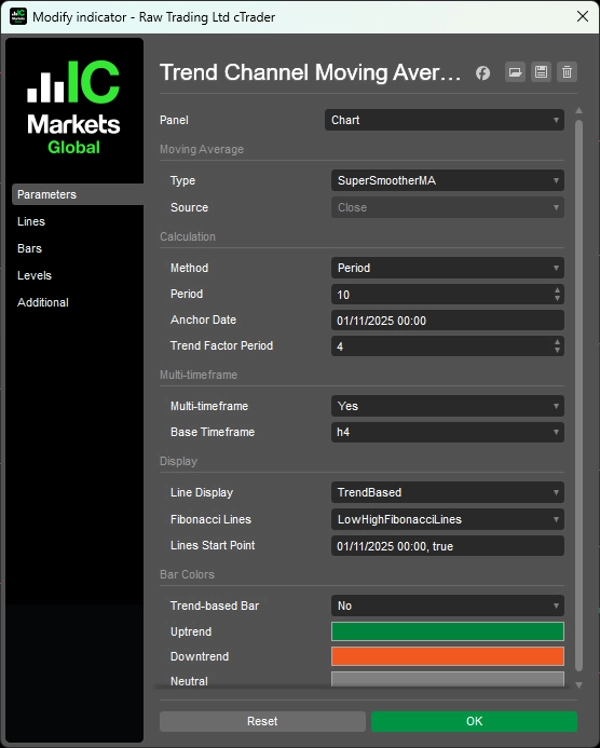
15 типов скользящих средних
- Профессиональные алгоритмы: Arnaud Legoux, Jurik, Hull, KAMA, VIDYA, Deviation Scaled, SuperSmoother, Ultimate Smoother, McGinley Dynamic, T3, ZLEMA, Laguerre
- Чистые сигналы, оптимизированные для идентификации тренда
Расширенный функционал
- Мульти-таймфреймный режим с плавной интерполяцией
- Вычисление якорной даты (период роста от конкретного события/уровня)
- Окраска баров по тренду (опционально)
- Контроль точки начала линий (скрыть исторические данные, показывать только недавнюю структуру)
__________________________________________________________________________________________
БОЛЬШЕ БЕСПЛАТНЫХ ИНДИКАТОРОВ
Исследуйте широкий спектр инструментов анализа рынка — от структуры и объёма до регрессии, волатильности и пользовательских таймфреймов.
Исходный код доступен в репозитории на GitHub repository.
Все бесплатно для использования. Но если хотите поддержать кофе, можете сделать это здесь.
Поддержка/Сопротивление
Объём
- Volume Activity Profiler
- Volume Efficiency Analyzer
- Volume Profile Analytics
- Volume Profile - Updated
- Volume Spread Analysis
- VWAP (Volume Weighted Average Price)
Скользящие средние
- SSL Channel
- Anchored Moving Average
- Deviation-Scaled Moving Average
- Gann High Low Activator
- Instantaneous Trendline
- Kaufman Adaptive MA with Trend Vision
- Moving Average Channel
- Moving Averages Suite
- Trend Channel Moving Average
Утилиты/Пользовательские
На основе регрессии
Волатильность
Осцилляторы
__________________________________________________________________________________________
ОТКАЗ ОТ ОТВЕТСТВЕННОСТИ
Торговля связана с риском. Этот индикатор предназначен только для технического анализа — всегда применяйте надлежащее управление рисками и торгуйте ответственно.
ОБРАТНАЯ СВЯЗЬ И УЛУЧШЕНИЯ
Если у вас есть предложения, запросы на функции или идеи для улучшения, пожалуйста, оставьте комментарий на вкладке Обсуждение. Ваш отзыв помогает улучшить индикатор для всех.
Сводка
Key features include two display modes—full channel and trend-based clutter reduction—and six optional Fibonacci zones covering full and half-channel retracements plus breakout extensions. The system supports 15 professional moving average algorithms such as Arnaud Legoux, Jurik, Hull, KAMA, VIDYA, and others, optimized for clean trend identification. Additional functionalities include multi-timeframe interpolation, anchor date calculation for event-based periods, trend-based bar coloring, and control over line start points to focus on recent data.
This indicator is designed to help traders identify pullbacks and mean reversion opportunities within defined channel boundaries, enhancing decision-making in various market conditions.
Отзывы покупателей
5 | 100 % | |
4 | 0 % | |
3 | 0 % | |
2 | 0 % | |
1 | 0 % |


![Логотип продукта "[Stellar Strategies] Inside Bar with Signals"](https://cdn.ctrader.com/image/webp/1d9e8bfa-3b2c-4440-bb37-5856902008a7_30683)