
Mô tả
🔧 ATR_RR_SignalPanel — Mô tả kỹ thuật & chi tiết (EN) 🧠📈
ATR_RR_SignalPanel là một chỉ báo phủ cho cTrader tạo ra tín hiệu vào lệnh thay đổi xu hướng sử dụng chế độ EMA nhanh so với EMA chậm, sau đó xây dựng một khung giao dịch ảo hoàn chỉnh (Vào lệnh 🏁, Cắt lỗ 🛑, Chốt lời cuối cùng 🎯, Mục tiêu trung gian 🟢) sử dụng định kích thước rủi ro dựa trên ATR và một hệ số Tỷ lệ Rủi ro:Lợi nhuận có thể cấu hình ⚖️.
🧭 Logic cốt lõi (Bộ máy tín hiệu) 🚦
- Chỉ báo tính toán:
-
- EMA nhanh ⚡ và EMA chậm 🐢 trên Giá đóng cửa.
- ATR (làm mượt Wilder) 🌡️ để xác định khoảng cách dừng dựa trên biến động.
- Một chế độ xu hướng được định nghĩa là:
-
- Xu hướng tăng 🟢 khi
EMA nhanh > EMA chậm - Xu hướng giảm 🔴 khi
EMA nhanh < EMA chậm
- Xu hướng tăng 🟢 khi
- Một Thay đổi xu hướng 🔁 kích hoạt khi trạng thái tăng/giảm khác với thanh trước đó (tương đương với Pine’s
bullTrend != bullTrend[1]).
🎯 Điều kiện vào lệnh (MUA/BÁN) 🟩🟥
Khi có thay đổi xu hướng xảy ra:
- Tín hiệu MUA 🟢 nếu:
-
- Xu hướng tăng đang hoạt động và phát hiện thay đổi xu hướng
- Xác nhận nến tùy chọn ✅: Đóng cửa > Mở cửa (nến tăng)
- Tín hiệu BÁN 🔴 nếu:
-
- Xu hướng giảm đang hoạt động và phát hiện thay đổi xu hướng
- Xác nhận nến tùy chọn ✅: Đóng cửa < Mở cửa (nến giảm)
🧪 Quản lý vị thế ảo (Không phải cBot) 🧩
Chỉ báo này không đặt lệnh. Thay vào đó nó mô phỏng một “vị thế ảo” nội bộ:
- Khi có tín hiệu MUA/BÁN mới, nó thiết lập:
-
- Giá vào lệnh = giá đóng cửa hiện tại 🏁
- Cắt lỗ = điểm cực đoan của nến ± ATR × hệ số 🛑
- Chốt lời cuối cùng = Vào lệnh ± (Rủi ro × Tỷ lệ Rủi ro:Lợi nhuận) 🎯
- Các mức TP trung gian = các bước tại 1R, 2R, … đến floor(RR)-1 🟢
- Nó theo dõi hành động giá từng thanh:
-
- Nếu TP cuối cùng bị chạm ➜ đánh dấu 🎯 và đóng vị thế ảo ✅
- Nếu SL bị chạm ➜ đánh dấu 🛑 và đóng vị thế ảo ❌
- Các lần chạm TP trung gian được theo dõi chỉ một lần duy nhất 🧷
🔁 Logic vô hiệu hóa (Tín hiệu ngược khi đang hoạt động) ⚠️
Nếu có tín hiệu mới đến trong khi vị thế ảo hướng ngược tồn tại:
- Lệnh vào trước đó được đánh dấu là BỊ VÔ HIỆU HÓA ⚠️ (INV MUA / INV BÁN)
- Vị thế ảo trước đó bị kết thúc 🧯
- Một vị thế ảo mới được tạo theo hướng mới 🔄
🧼 An toàn đa phiên bản (Nhiều bản sao trên cùng biểu đồ) 🧩🧩
Mỗi phiên bản chỉ báo tạo một ID nội bộ duy nhất 🆔, vì vậy:
- Các đường/dòng chữ từ một phiên bản sẽ không ghi đè lên phiên bản khác ✅
- Bạn có thể chạy nhiều cấu hình song song (ví dụ, scalping + swing) 🧠📊
🧯 Kiểm soát chống lộn xộn (Giới hạn đánh dấu) 🧹✨
Để giữ biểu đồ dễ đọc, nó có thể:
- Giới hạn số lượng các đánh dấu văn bản được vẽ (MUA/BÁN/TP/SL/INV/TP1…) 🧾
- Tự động xóa các đánh dấu cũ hơn khi vượt quá giới hạn ♻️
🧷 Tùy chọn “Giữ lại các đường rủi ro cuối cùng” 🧠📌
Khi bật, các đường Vào lệnh/SL/TP cuối cùng vẫn hiển thị ngay cả sau khi TP/SL đóng:
- Tuyệt vời cho việc xem lại sau giao dịch 🧑🔬
- Tuyệt vời cho việc ghi nhật ký 📒✅
⚙️ Tham số — Giải thích chi tiết (EN) 🔍📌
📈 Cốt lõi tín hiệu & rủi ro
⚡ EMA nhanh
- Nó làm gì 🧠: Đặt chu kỳ của EMA nhanh dùng để phát hiện sự chuyển đổi chế độ.
- Ảnh hưởng 📊: Giá trị thấp hơn = phản ứng nhanh hơn ➜ nhiều tín hiệu hơn; giá trị cao hơn = mượt hơn ➜ ít tín hiệu hơn.
- Phạm vi điển hình 🎛️: 3–10 cho thị trường nhanh ⚡, 10–20 cho thiết lập yên tĩnh hơn 🐢
🐢 EMA chậm
- Nó làm gì 🧠: Đặt chu kỳ của EMA chậm dùng làm cơ sở xu hướng.
- Ảnh hưởng 📊: EMA chậm cao hơn = lọc mạnh hơn ➜ ít kích hoạt thay đổi xu hướng hơn.
- Phạm vi điển hình 🎛️: 13–55 tùy phong cách 🧭
🌡️ Chu kỳ ATR
- Nó làm gì 🧠: Kiểm soát độ dài đo biến động cho ATR.
- Ảnh hưởng 📏: ATR ngắn phản ứng nhanh (SL chặt hơn), ATR dài ổn định hơn (SL ổn định hơn).
- Phạm vi điển hình 🎛️: 10–21 là phổ biến ✅
🛑 Hệ số SL (ATR)
- Nó làm gì 🧠: Xác định khoảng cách Cắt lỗ theo đơn vị ATR.
- Mua dài 🟢:
SL = Thấp - ATR * Hệ số - Bán ngắn 🔴:
SL = Cao + ATR * Hệ số - Ảnh hưởng 🎯: Hệ số cao hơn = SL rộng hơn (ít bị dừng, rủi ro lớn hơn); thấp hơn = SL chặt hơn (dễ bị dừng hơn).
- Giá trị điển hình 🎛️: 0.3–2.0 tùy biến động 🌪️
⚖️ Tỷ lệ Rủi ro:Lợi nhuận (R:R)
- Nó làm gì 🧠: Nhân khoảng cách “rủi ro” để tính TP cuối cùng.
- Công thức 📌:
-
- Rủi ro = |Vào lệnh − SL|
- TP cuối cùng = Vào lệnh ± Rủi ro × RR 🎯
- TP trung gian 🟢: TP1 tại 1R, TP2 tại 2R, … đến
floor(RR)-1 - Ví dụ 🧪: RR=3 ➜ TP1 (1R), TP2 (2R), TP cuối cùng (3R) 🎯🎯🎯
✅ Yêu cầu xác nhận nến
- Nó làm gì 🧠: Thêm xác nhận hướng nến trên thanh tín hiệu.
- MUA 🟢: yêu cầu Đóng cửa > Mở cửa
- BÁN 🔴: yêu cầu Đóng cửa < Mở cửa
- Ảnh hưởng 🧽: Lọc các đảo chiều yếu, giảm nhiễu, có thể vào lệnh muộn hơn ⏳
📌 Hiển thị EMAs
👁️ Hiển thị EMA nhanh
- Nó làm gì 🧠: Hiển thị/ẩn đường EMA nhanh.
- Trường hợp sử dụng 💡: Ẩn nếu bạn muốn biểu đồ sạch sẽ 🧼
👁️ Hiển thị EMA chậm
- Nó làm gì 🧠: Hiển thị/ẩn đường EMA chậm.
- Trường hợp sử dụng 💡: Giữ hiển thị để có bối cảnh xu hướng 🧭
🎛️ Điều khiển hình ảnh (Quản lý lộn xộn) 🧹✨
🚦 Hiển thị tín hiệu
- Nó làm gì 🧠: Hiển thị/ẩn các đánh dấu MUA/BÁN.
- Bao gồm 🧷: Các đánh dấu MUA 🟢 / BÁN 🔴 (chỉ)
- Mẹo 💡: Tắt để dùng chế độ “chỉ đường” 📏
🏷️ Hiển thị nhãn TP
- Nó làm gì 🧠: Hiển thị/ẩn các nhãn như TP1, TP2…
- Ảnh hưởng 🧼: Tắt sẽ loại bỏ nhiều tiếng ồn văn bản trên các khung thời gian cao hơn 📉
- Lưu ý 🧷: Nhãn chỉ xuất hiện một lần cho mỗi lần chạm TP ✅
⚠️ Hiển thị dấu vô hiệu hóa
- Nó làm gì 🧠: Hiển thị/ẩn các đánh dấu INV MUA / INV BÁN.
- Trường hợp sử dụng 🧠: Hữu ích khi bạn muốn nghiên cứu các đảo chiều tín hiệu 🔁
🎯🛑 Hiển thị dấu TP/SL cuối cùng
- Nó làm gì 🧠: Hiển thị/ẩn các đánh dấu TP và SL cuối cùng.
- Trường hợp sử dụng 📒: Tuyệt vời để xem lại phân phối kết quả 🎲
📏 Hiển thị các đường rủi ro (Vào lệnh/SL/TP)
- Nó làm gì 🧠: Vẽ các đường Vào lệnh 🏁, SL 🛑, TP cuối cùng 🎯 trên biểu đồ.
- Ảnh hưởng 📌: Hiển thị cấu trúc giao dịch ảo ngay lập tức 🧠
🟢 Hiển thị các đường TP trung gian
- Nó làm gì 🧠: Vẽ các đường chấm cho các mức TP1/TP2/...
- Mẹo 🧼: Tắt nếu biểu đồ trở nên quá “mì ý xanh” 🍝🟢
📌 Giữ lại các đường rủi ro cuối cùng
- Nó làm gì 🧠: Giữ các đường Vào lệnh/SL/TP cuối cùng hiển thị sau khi thoát ảo (TP/SL).
- Tại sao hữu ích 📒: Hoàn hảo cho việc ghi nhật ký & phân tích sau giao dịch 🧑🔬✅
🧾 Số lượng đánh dấu tối đa trên biểu đồ (0=không giới hạn)
- Nó làm gì 🧠: Giới hạn số lượng đối tượng văn bản mà chỉ báo để lại trên biểu đồ.
- Cách hoạt động ♻️: Khi vượt quá giới hạn, các đánh dấu cũ nhất sẽ tự động bị xóa.
- Khuyến nghị 🎛️: 80–200 tùy khung thời gian và độ sâu lịch sử 🕰️
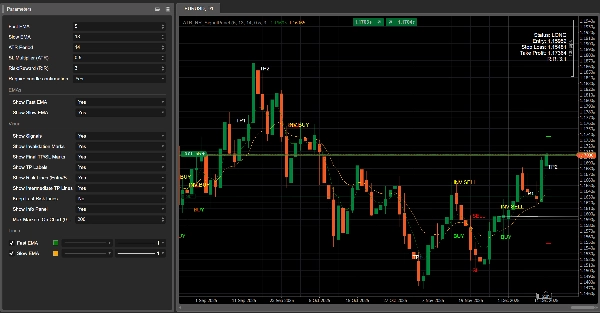
🧾 Hiển thị bảng thông tin
- Nó làm gì 🧠: Hiển thị bảng trạng thái gọn nhẹ trên biểu đồ.
- Hiển thị 📋: Trạng thái (DÀI/NGẮN/Không có vị thế), Vào lệnh, SL, TP, RR tính toán.
Tóm tắt
The indicator simulates virtual trades by setting entry price, stop loss, and take profit levels using Average True Range (ATR) for volatility-based risk sizing combined with a configurable risk-to-reward multiplier. It tracks intermediate take profit levels and monitors price action bar-by-bar to mark virtual trade outcomes without placing actual orders.
Key features include optional candle confirmation for signals, multi-instance support to run multiple configurations on the same chart, and visual clutter controls such as limiting markers and toggling display of EMAs, signals, and risk lines. An info panel provides a compact status overview of virtual positions. Parameters allow customization of EMA periods, ATR period, stop loss multiplier, and risk-reward ratio to adapt to different trading styles and market conditions.
Supported markets include Forex, indices, commodities, stocks, and cryptocurrencies, with symbols like GBPUSD, EURUSD, XAUUSD, NAS100, and BTCUSD among the tagged assets.
Đánh giá của khách hàng
5 | 100 % | |
4 | 0 % | |
3 | 0 % | |
2 | 0 % | |
1 | 0 % |


