
Description
APERÇU
Fondation : Principes de Wyckoff
Cet indicateur est construit sur deux concepts complémentaires de la méthodologie Wyckoff :
1. Effort vs Résultat
Le principe fondamental de Wyckoff stipule que le mouvement du prix (résultat) doit être proportionnel au volume qui le sous-tend (effort). Lorsque l'effort et le résultat sont en harmonie, le marché se comporte normalement. Lorsqu'ils divergent, cela signale des points de retournement potentiels ou une force de continuation.
Cet indicateur met directement en œuvre ce principe à travers la Efficacité (résultat par unité d'effort) et son inverse, Absorption (effort ne se traduisant pas en résultat).
2. Analyse de l'Écart
Wyckoff insistait également sur l'analyse du caractère des barres de prix individuelles — en examinant l'écart (plage), où le prix a clôturé dans cette plage, et si la barre montrait un engagement ou une indécision.
Cet indicateur implémente l'analyse de l'écart via Conviction (engagement directionnel), Ratio de Gaspillage (retracement à l'intérieur de la barre), et Position de Clôture (utilisée pour contextualiser l'absorption comme accumulation ou distribution).
CE QUE FAIT CET INDICATEUR
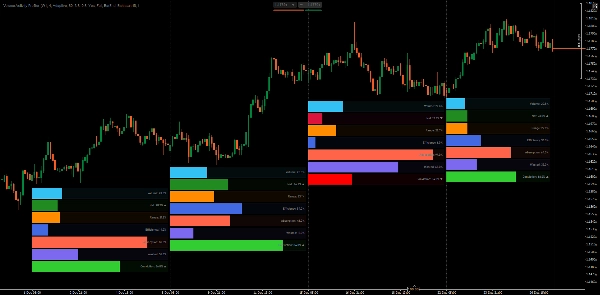
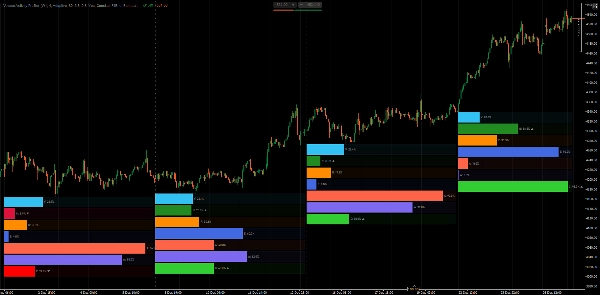
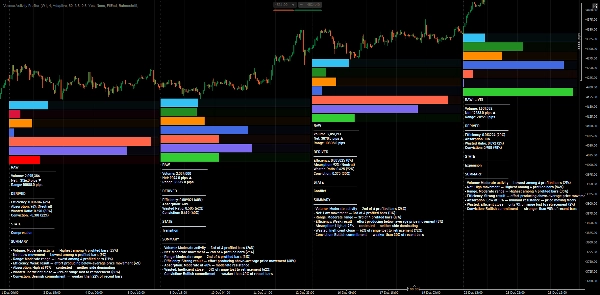
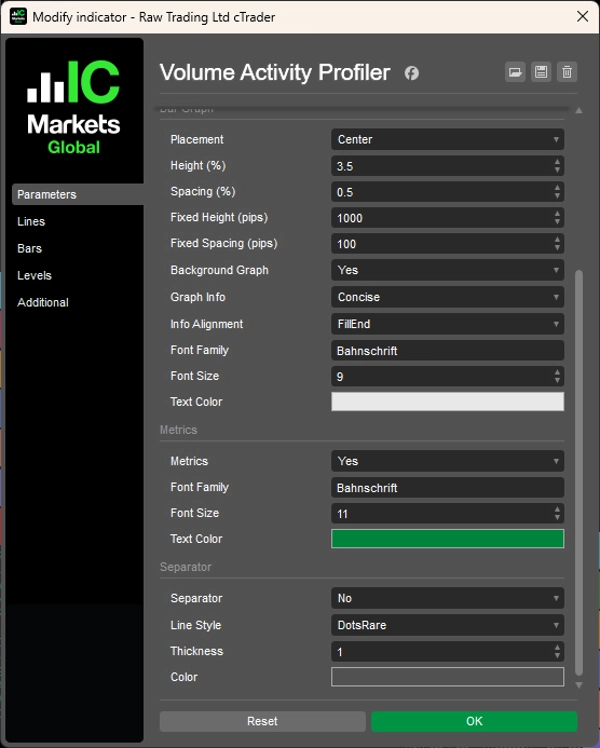
Le Profileur d'Activité de Volume analyse les barres de prix d'une période sélectionnée et décompose leur activité en composants mesurables. Il calcule à la fois des métriques brutes et des métriques dérivées basées sur des percentiles, puis les affiche sous forme de graphiques à barres horizontales ancrés sous chaque barre analysée.
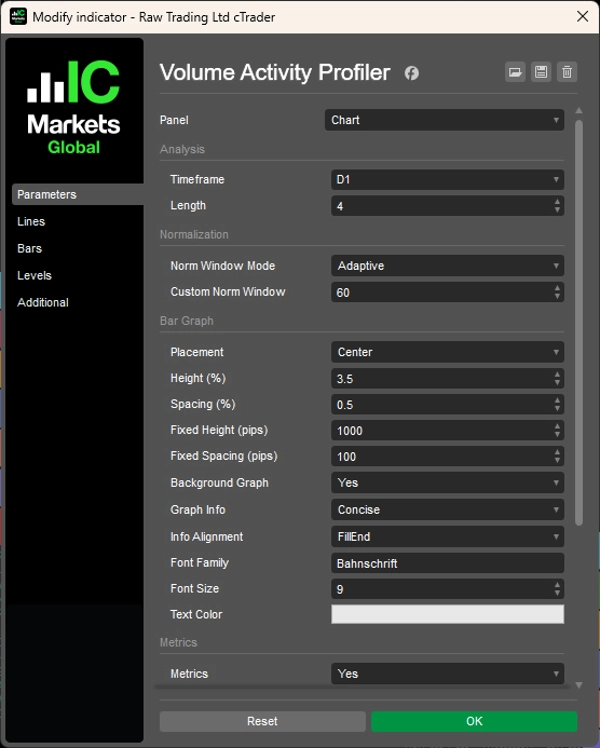
Vous configurez deux paramètres principaux :
- Période : La période à analyser (par exemple, Hebdomadaire, Quotidien, H4)
- Longueur : Combien de barres profiler (par exemple, les 4 dernières barres)
L'indicateur profile ensuite chaque barre dans cette portée, calculant les métriques et les classant les unes par rapport aux autres et par rapport aux normes historiques.
EXPLICATION DES MÉTRIQUES
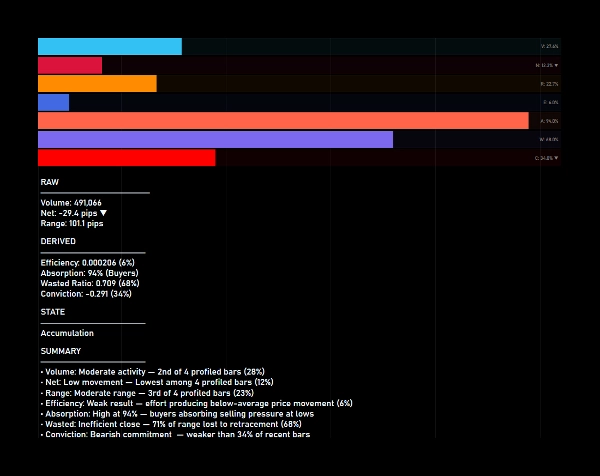
Métriques brutes (proportionnelles parmi les barres profilées) :
1. Volume
Volume de ticks de la barre. Montre quelle proportion du volume total profilé cette barre représente.
2. Net
Mouvement directionnel (clôture − ouverture) en pips. Montre la proportion du mouvement net total. La couleur indique la direction (vert = haussier, rouge = baissier).
3. Plage
Plage totale des prix (haut − bas) en pips. Montre la proportion de la plage totale parmi les barres profilées.
Métriques dérivées (basées sur les percentiles par rapport à la fenêtre historique) :
1. Efficacité (Effort vs Résultat)
Plage produite par unité de volume. Une haute efficacité signifie que l'effort se traduit en mouvement de prix. Une faible efficacité suggère une absorption ou une résistance.
2. Absorption (Effort vs Résultat)
Inverse de l'efficacité. Une forte absorption indique que le volume est absorbé sans mouvement de prix proportionnel — accumulation ou distribution potentielle.
3. Gaspillage (Analyse de l'Écart)
Pourcentage de la plage perdu à cause du retracement (plage − net) / plage. Un gaspillage élevé signifie que la barre a rendu une grande partie de son mouvement. Un faible gaspillage indique une barre propre et directionnelle.
4. Conviction (Analyse de l'Écart)
Engagement directionnel mesuré comme net/plage. Une forte conviction signifie que la barre a clôturé près de son extrême. Une faible conviction indique une indécision ou un rejet.
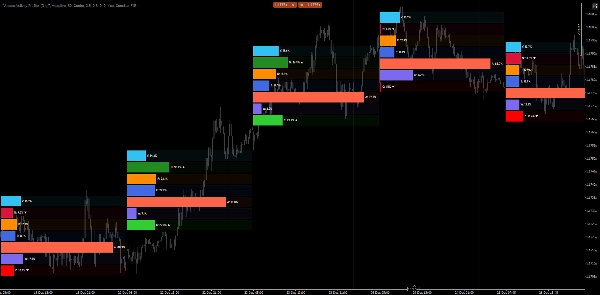
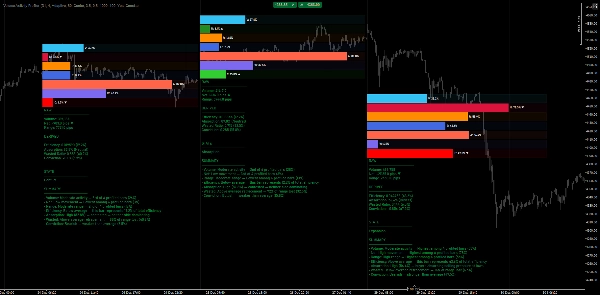
COMPRENDRE LES GRAPHIQUES À BARRES
Chaque barre profilée affiche 7 barres horizontales :
- Volume, Net, Plage — Remplies selon la proportion parmi les barres profilées
- Efficacité, Absorption, Gaspillage, Conviction — Remplies selon le rang percentile par rapport aux données historiques
Une barre remplie à 80 % sur l'Efficacité signifie que l'efficacité de cette barre est supérieure à 80 % des barres dans la fenêtre de normalisation.
CLASSIFICATION DE L'ÉTAT D'ACTIVITÉ
Lorsque l'affichage des métriques est activé, l'indicateur classe chaque barre dans l'un de ces états :
1. Compression
Faible efficacité + faible conviction — le prix s'enroule, énergie potentielle en construction
2. Expansion
Haute efficacité + haute conviction + faible gaspillage — mouvement directionnel fort
3. Conflit
Gaspillage élevé + faible conviction — bataille entre acheteurs et vendeurs
4. Accumulation
Forte absorption + clôture près des bas — acheteurs absorbant la pression vendeuse
5. Distribution
Forte absorption + clôture près des hauts — vendeurs absorbant la pression acheteuse
6. Rejet
Forte conviction mais clôture opposée à la direction — mouvement échoué, renversement potentiel
7. Transition
Signaux mixtes — marché en transition entre états
AVANTAGES PRATIQUES
- Évaluation rapide effort vs résultat — Voir instantanément si le volume produit un mouvement proportionnel ou est absorbé.
- Analyse de structure multi-périodes — Analyser les barres de périodes supérieures tout en restant sur votre période d'exécution.
- Identifier accumulation/distribution — Une forte absorption avec positionnement de clôture révèle où les gros acteurs peuvent être actifs.
- Repérer l'épuisement et le rejet — Une forte conviction avec une position de clôture opposée avertit des renversements potentiels.
- Comparer les barres objectivement — Les classements et percentiles éliminent la subjectivité des évaluations de volume "élevé" ou "faible".
- Confirmer les cassures — L'état d'expansion avec haute efficacité et conviction confirme un intérêt réel pour la cassure.
VOLUME DE TICKS COMME PROXY D'EFFORT
Cet indicateur utilise le volume de ticks comme entrée d'effort. En forex, le volume de ticks représente la fréquence des changements de prix plutôt que le volume réellement échangé — une limitation connue des marchés décentralisés.
Malgré cela, le volume de ticks sert efficacement de proxy d'effort car :
- Il reflète l'activité relative du marché entre les barres
- Un nombre élevé de ticks indique un engagement accru des participants
- La relation effort vs résultat tient — une forte activité produisant peu de mouvement signale toujours une absorption
Les classements en percentiles et les comparaisons de barres de l'indicateur restent valides tant que les données sont cohérentes.
REMARQUES
- L'indicateur utilise des fenêtres de normalisation adaptatives basées sur la période lorsqu'il est réglé en mode Adaptatif, assurant un contexte historique pertinent.
- Les calculs de percentiles se mettent à jour uniquement sur les barres complètes pour éviter des lectures instables sur les barres en formation.
- La barre en formation actuelle est marquée par [LIVE] dans le panneau des métriques.
__________________________________________________________________________________________
PLUS D'INDICATEURS GRATUITS
Explorez une large gamme d'outils d'analyse de marché — de la structure et du volume à la régression, la volatilité et les périodes personnalisées.
Le code source est disponible sur le dépôt GitHub.
Tous gratuits à utiliser. Mais si vous souhaitez offrir un café en soutien, vous pouvez le faire ici.
Support/Résistance
Volume
- Profileur d'activité de volume
- Analyseur d'efficacité de volume
- Analyse du profil de volume
- Profil de volume - Mis à jour
- Analyse de l'écart de volume
- VWAP (Prix moyen pondéré par le volume)
Moyennes mobiles
- Canal SSL
- Moyenne mobile ancrée
- Moyenne mobile à échelle de déviation
- Activateur Gann Haut Bas
- Ligne de tendance instantanée
- MA adaptative Kaufman avec Trend Vision
- Canal de moyenne mobile
- Suite de moyennes mobiles
- Moyenne mobile du canal de tendance
Utilitaires/Personnalisé
Basé sur la régression
Volatilité
Oscillateurs
__________________________________________________________________________________________
AVERTISSEMENT
Le trading comporte des risques. Cet indicateur est destiné uniquement à l'analyse technique — appliquez toujours une gestion des risques appropriée et tradez de manière responsable.
RETROACTION & AMÉLIORATIONS
Si vous avez des suggestions, des demandes de fonctionnalités ou des idées d'amélioration, veuillez laisser un commentaire dans l'onglet Discussion. Vos retours aident à améliorer l'indicateur pour tous.
Résumé
The indicator profiles price bars over a user-selected timeframe and length, calculating raw metrics such as Volume (tick volume proportion), Net (directional price movement), and Range (price range). It also derives percentile-based metrics including Efficiency (price movement per volume unit), Absorption (volume without proportional price change), Wasted Ratio (retracement within the bar), and Conviction (directional commitment).
These metrics are visually represented as horizontal bar graphs beneath each analyzed bar, facilitating objective comparison and historical context. The indicator classifies bars into activity states like Compression, Expansion, Conflict, Accumulation, Distribution, Rejection, and Transition, aiding in identifying market phases and potential turning points.
Volume Activity Profiler uses tick volume as an effort proxy, reflecting relative market activity. It supports multi-timeframe analysis and updates percentile rankings on completed bars to ensure stable readings. This tool assists traders in assessing volume efficiency, spotting accumulation/distribution, confirming breakouts, and understanding market structure through quantitative volume and price bar analysis.
Avis clients
5 | 100 % | |
4 | 0 % | |
3 | 0 % | |
2 | 0 % | |
1 | 0 % |


![Logo de "[CB] Pivot Points Pro"](https://cdn.ctrader.com/image/webp/43463c82-67b0-4f10-a4ba-901bba091d81_32594)


