
Description
Profil TPO quotidien
Indicateur de profil TPO quotidien qui calcule le POC, VAH et VAL pour chaque session.
Trace le Point de Contrôle et la Zone de Valeur à 70 % directement sur le graphique, vous aidant à identifier les zones de juste valeur, les niveaux clés de support/résistance et les zones potentielles de rejet ou d'acceptation des prix.
Comment ça fonctionne
Cet indicateur construit un profil TPO (Time Price Opportunity) quotidien, similaire à un Market Profile.
Pour chaque barre de la journée de trading, il :
- divise l'axe des prix en “pas” fixes définis par “Taille de ligne (pips)”
- pour chaque pas de prix, compte combien de barres ont touché ce niveau (TPO = combien de fois le prix a été échangé à cet endroit)
- à la fin de la journée, il calcule :
-
- POC (Point de Contrôle) → le niveau de prix avec le plus grand nombre de TPO (où le marché a passé le plus de temps)
- VAH (Valeur Haute) et VAL (Valeur Basse) → les niveaux de prix qui contiennent environ pourcentage de la zone de valeur (par défaut 70 %) de tous les TPO pour cette session
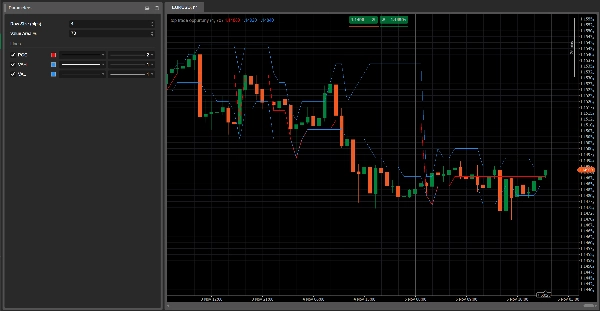
L'indicateur trace trois lignes horizontales sur le graphique :
- Ligne rouge → POC
- Lignes bleues → VAH (supérieure) et VAL (inférieure)
Ces lignes sont mises à jour barre par barre pendant la session et réinitialisées lorsqu'une nouvelle journée de trading commence.
Paramètres principaux
Taille de ligne (pips)
Définit l'épaisseur de chaque pas de prix dans le profil.-
- Valeurs plus petites = profil plus détaillé
- Valeurs plus grandes = profil plus lisse
Pourcentage de la zone de valeur
Pourcentage du total des TPO contenus dans la zone de valeur (typiquement 70 %).
La zone de valeur est la zone de prix où la majeure partie de l'activité du marché a eu lieu pendant la journée.
Comment le lire
- POC (ligne rouge)
-
- Le niveau de prix le plus “accepté” par le marché durant cette journée.
- Agit souvent comme un niveau d'équilibre : le prix peut rebondir, stagner ou fortement casser autour de cette zone.
- Zone de valeur (VAH–VAL, lignes bleues)
-
- Représente la zone de “juste valeur” où la plupart des échanges ont eu lieu.
- L'action des prix par rapport à VAH/VAL peut montrer :
-
- Rejet des prix extrêmes (fausses cassures au-delà de VAH/VAL)
- Acceptation de nouveaux prix (consolidation en dehors de la zone de valeur)
Idées d'utilisation typiques
- Le prix rejette VAL et revient à l'intérieur de la zone de valeur → idée d'achat potentielle, pariant sur un retour à la “juste valeur” (réversion à la moyenne).
- Le prix casse au-dessus de VAH avec force et commence à construire une structure au-dessus → début potentiel d'une nouvelle zone de valeur plus haute (scénario de suivi de tendance).
- Plusieurs jours avec des POC autour du même niveau → zone d'équilibre/accumulation forte, souvent un support/résistance clé.
Résumé
The indicator plots these levels as horizontal lines on the chart—POC in red, VAH and VAL in blue—updating them bar by bar during the session and resetting daily. Traders use the POC as an equilibrium price level that may act as support or resistance. The Value Area highlights fair value zones, with price action near VAH and VAL signaling potential rejection or acceptance of price extremes. Typical applications include identifying mean reversion opportunities when price rejects VAL or trend-following setups when price breaks above VAH.
Main adjustable parameters include Row Size (pips), controlling profile detail, and Value Area %, defining the percentage of TPOs included in the value area. The indicator supports analysis across various markets including forex, indices, commodities, stocks, and cryptocurrencies.


![Logo de "[Hamster-Coder] Moving Average MTF"](https://cdn.ctrader.com/image/webp/b11b98b1-194d-4b8e-b00e-d611826ad159_31226)