
Previous day Key Levels
Indicateur
411 téléchargements
Version 1.0, Oct 2025
Windows, Mac
4.0
Avis : 1
Description
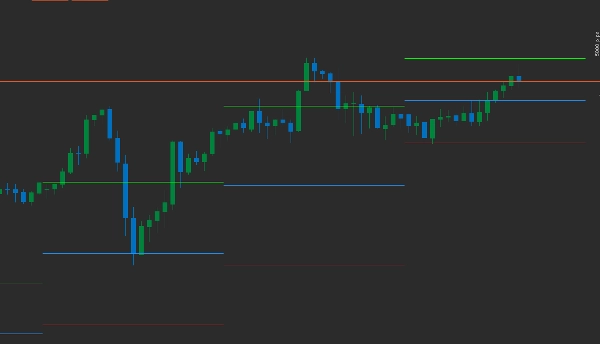
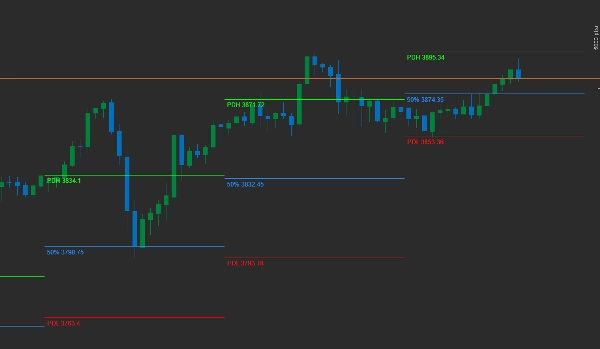
Cet indicateur trace le plus haut, le plus bas et le retracement à 50 % de la journée précédente.
L'utilisateur peut activer/désactiver l'historique
Avec l'historique activé, vous pouvez sélectionner le nombre de jours à afficher.
Changez les couleurs de chaque ligne
Activez/désactivez l'étiquette identifiant chaque ligne
Résumé
Résumé IA
The Previous Day Key Levels indicator plots the prior trading day's High, Low, and 50% retracement levels on the chart. Users can customize the display by enabling or disabling historical data and selecting the number of past days to view. The indicator allows color customization for each line and the option to show or hide labels identifying each level. It supports various markets and symbols including Forex pairs (EURUSD, GBPUSD, NZDUSD, USDJPY), cryptocurrencies (BTCUSD, crypto), commodities (XAUUSD, gold, oil, silver), indices (NAS100, Dow, S&P 500, DAX), and stocks. This tool is designed to assist traders in identifying key price levels from the previous day that may influence current market behavior.
Profil de l'indicateur
Avis clients
4.0
Avis : 1
5 | 0 % | |
4 | 100 % | |
3 | 0 % | |
2 | 0 % | |
1 | 0 % |
Avis clients
December 1, 2025
Previous Day Key Levels marks yesterday’s High, Low, Open, Close and midpoint - clean, fast and reliable. Great for intraday structure, liquidity zones and reaction points. Lightweight and useful on any timeframe. Alerts and range-zone shading would make it even better.
Discussion
Questions fréquentes
BTCUSD
Forex
Breakout
Indices
EURUSD
Commodities
GBPUSD
NZDUSD
Scalping
Crypto
Stocks
XAUUSD
NAS100
USDJPY
Les produits disponibles sur cTrader Store, notamment les bots de trading, les indicateurs et les plug-ins, sont fournis par des développeurs tiers et mis à disposition à titre informatif et à des fins d'accès technique uniquement. cTrader Store n'est pas un courtier et ne fournit aucun conseil en investissement, aucune recommandation personnelle ni aucune garantie quant aux performances futures.
Plus de cet auteur


![Logo de "[Stellar Strategies] Market Session Ultimate"](https://cdn.ctrader.com/image/webp/61ffd537-0125-4246-9e72-42eca1791d64_28232)


Prix
Depuis le 30/01/2025
36.05M
Volume tradé
26.73K
Pips gagnés
1.24K
Installations gratuites