Description
📊 VALEUR ESPÉRÉE VPOC MONTE CARLO
https://chartshots.spotware.com/c/69c558e2c68df
Analyse de marché intégrée : Profil de volume + Projection statistique 🎯
🎯 QU’EST-CE QUE C’EST ?
La valeur espérée VPOC Monte Carlo est un indicateur d’analyse quantitative qui combine deux méthodologies professionnelles de trading :
- Profil de profondeur de marché (VPOC) - Identifie où le volume est réellement concentré 🏦
- Simulation Monte Carlo - Projette des scénarios futurs basés sur des probabilités statistiques 📈
Le résultat est un système d’analyse qui vous indique où se trouve l’argent (Point de Contrôle) et où il est susceptible d’aller (valeur espérée projetée) 🧠
⚙️ COMMENT ÇA FONCTIONNE ?
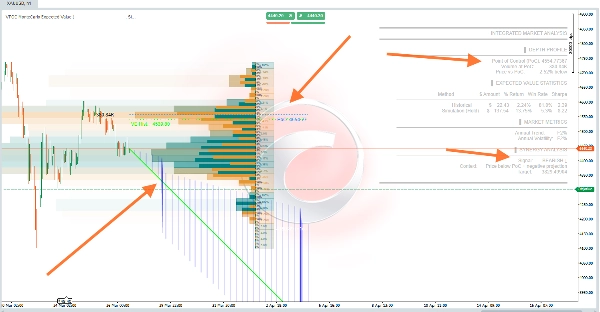
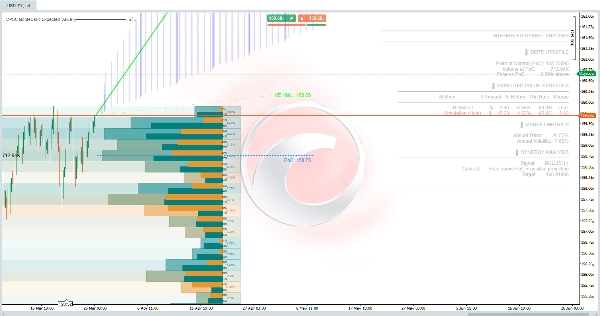
Module 1 : Profil de profondeur (VPOC) 📊
L’indicateur analyse les 200 dernières barres (configurable) et répartit le volume sur 30 niveaux de prix. Il calcule :
- Point de Contrôle (PoC) : Le prix avec le volume échangé le plus élevé - représente le consensus du marché où acheteurs et vendeurs ont été les plus actifs ⚖️
- Delta : Différence entre la pression d’achat et de vente à chaque niveau 🔄
- Carte thermique : Visualisation de la concentration d’activité 🔥
La logique : Le prix tend à revenir vers le PoC car c’est là que réside la majorité de la liquidité en attente. Si le prix est éloigné du PoC, la probabilité de retour est plus élevée 🔄
Module 2 : Projection statistique (Monte Carlo) 🎲
Utilise des simulations stochastiques (1 000 itérations par défaut) pour projeter le prix futur :
- Calcule la tendance historique de l’actif et la volatilité annualisée 📉📈
- Génère des trajectoires aléatoires selon une distribution normale (modèle de mouvement brownien géométrique) 🌊
- Estime la valeur espérée avec des bandes d’écart-type (±1 sigma) 📏
Formule appliquée : - Dérive par barre = Rendement annualisé / jours de trading 🧮
- Volatilité par barre = Volatilité annualisée / √jours ⚡
- Projection = Prix actuel × e^(dérive totale + aléatoire normal × volatilité totale) 🔢
Module 3 : Synergie 🔗
Combine les deux analyses pour générer des signaux contextuels :
Tableau
Condition du signal Signification
HAUSSIER ↑ 🟢 Prix > PoC + Projection positive Tendance haussière confirmée par le volume
BAISSIER ↓ 🔴 Prix < PoC + Projection négative Tendance baissière confirmée par le volume
OPPORTUNITÉ ★ 💡 Prix < PoC + Projection positive Rebond possible depuis le support de volume
DIVERGENCE ⚠️ ⚠️ Prix > PoC + Projection négative Avertissement de possible retournement
📈 À QUOI ÇA SERT ?
✅ Identifier les niveaux clés de volume - Le PoC agit comme un aimant de prix 🧲
✅ Estimer les probabilités de succès - Pourcentage de scénarios gagnants dans la simulation 🏆
✅ Évaluer le risque/rendement - Ratio de Sharpe projeté et écart-type 📊
✅ Confirmer la direction du trade - Synergie entre la position relative au PoC et le momentum statistique 🎯
✅ Projection cible - Niveaux de prix attendus pour la période de détention définie 🎯
🎮 CONFIGURATION ET UTILISATION
Paramètres principaux :
Tableau
Groupe Paramètre Défaut Description
Analyse du profil de profondeur 200 barres Historique pour calculer le profil de volume
Niveaux de prix 30 Résolution du profil (plus de niveaux = plus de détails) 🔍
Décalage horizontal 5 Position du profil sur le graphique 📏
Projection statistique Durée max d’opération 252 barres Horizon temporel de la projection ⏱️
Capital investi 1 000 $ Base pour les calculs monétaires 💰
Simulations 1 000 Nombre de trajectoires aléatoires (plus = plus précis, plus lent) 🔄
Taux sans risque 5 % Pour le calcul du ratio de Sharpe 📉
Stratégie historique Utiliser TP/SL Non Activer pour simuler avec des objectifs fixes 🎯
Comment interpréter les résultats Tableau :
plain
Copy
STATISTIQUES DE LA VALEUR ESPÉRÉE
┌──────────────┬─────────┬─────────┬─────────┬────────┐
│ Méthode │ Montant $│ % Rendement│ Taux de gain│ Sharpe │
├──────────────┼─────────┼─────────┼─────────┼────────┤
│ Historique │ -19,56 $ │ -1,96% │ 47,2 % │ -1,24 │
│ Simulation │ -54,05 $ │ -5,40% │ 21,4 % │ -4,95 │
└──────────────┴─────────┴─────────┴─────────┴────────┘
- Historique : Performance moyenne des trades passés similaires 📜
- Simulation : Résultat moyen des 1 000 simulations Monte Carlo 🎲
- Taux de gain : Pourcentage de scénarios avec résultat positif ✅
- Sharpe : Rendement ajusté au risque (supérieur à 1 est bon, négatif est mauvais) 📈
🖼️ Éléments visuels sur le graphique
Tableau
Élément Couleur Signification
Profil de volume Dégradé orange/bleu Concentration d’activité par niveau de prix 🎨
Ligne PoC Pointillés bleus Point de Contrôle projeté dans le futur 🔵
Ligne de projection EV Vert/Magenta Trajectoire de prix attendue 🟢🔴
Bande ±1σ Lignes pointillées blanches Intervalle de confiance à 68 % 📊
Ligne EV historique Pointillés verts Valeur espérée basée sur les données historiques 🟢
Zone de projection Remplissage bleu translucide Zone de probabilité entre les bandes 🔵
⚠️ IMPORTANT - Limitations
- Ce n’est pas un signal d’achat/vente - C’est un outil d’analyse probabiliste 🛠️
- Les simulations Monte Carlo supposent que la distribution historique se maintient (ne prédit pas les événements cygnes noirs) 🦢❌
- Le PoC est dynamique - Se recalcule à chaque nouvelle barre 🔄
- Nécessite un historique suffisant - Minimum 252 barres pour des projections fiables 📊
- Cryptomonnaies - L’indicateur s’ajuste automatiquement à 365 jours de trading annuels contre 252 pour les marchés traditionnels 🪙
💡 Stratégie d’utilisation recommandée
- Cherchez une OPPORTUNITÉ ★ 💡 - Prix en dessous du PoC mais avec projection positive (sous-évaluation possible)
- Confirmez avec un taux de gain > 50 % - Probabilité statistique de succès plus élevée ✅
- Évitez la DIVERGENCE ⚠️ ⚠️ - Prix surévalué par rapport au volume réel
- Utilisez le PoC comme référence - Stops ou objectifs autour de ce niveau de liquidité 🎯
- Comparez Historique vs Simulation - S’ils diffèrent fortement, le régime de marché change 🔄
Résumé
Using Monte Carlo simulations with default 1,000 iterations, it projects future price scenarios based on historical trends and volatility, applying a geometric Brownian motion model. This generates expected price trajectories with confidence bands (±1 standard deviation), estimating probabilities of success, risk-adjusted returns (Sharpe ratio), and potential target levels.
The combined analysis produces contextual signals such as Bullish, Bearish, Opportunity, and Divergence, based on price relation to PoC and projection direction. It supports various markets including Forex, stocks, commodities, indices, and cryptocurrencies, adjusting parameters like trading days accordingly.
Key configurable settings include analysis period, profile resolution, simulation count, and risk-free rate. Visual elements on the chart display volume profiles, PoC lines, expected value projections, and confidence intervals. The tool is designed for probabilistic market assessment and trade confirmation rather than direct buy/sell signals.