

ScalperSignalVisual
Wskaźnik
213 pobrania
Wersja 1.0, Aug 2025
Windows, Mac

1
Sprzedaż
1.91K
Bezpłatne instalacje
Opis
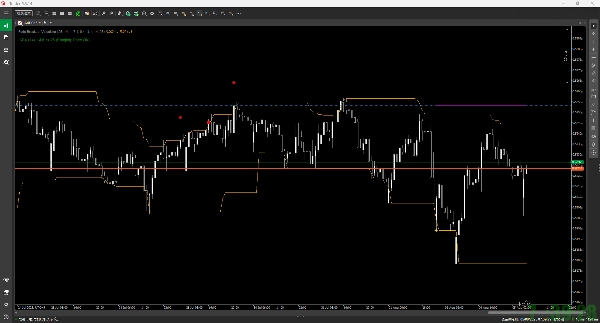
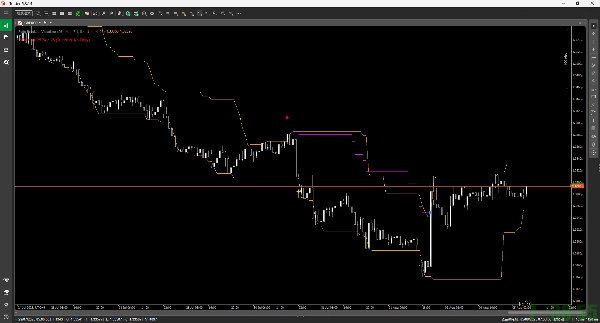
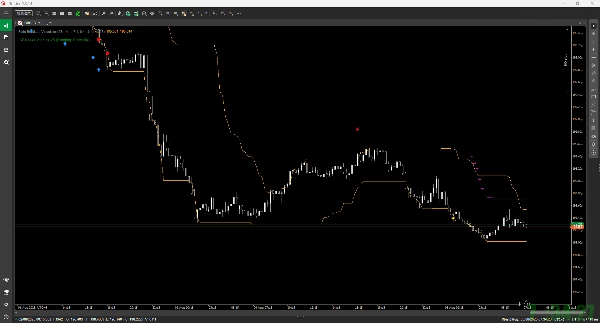
Ten wskaźnik to narzędzie do wizualizacji logiki handlu strategii kontrariańskiej zwanej "Fade Breakout" na Twoim wykresie. Nie wykonuje rzeczywistych transakcji, ale pokazuje, jak pozycja byłaby zarządzana od wejścia do wyjścia, gdy pojawi się sygnał.
Kluczowe funkcje
- Sygnały wejścia:
-
- Wykorzystuje Kanał Donchiana.
- Sygnał kupna (kontrariański): Gdy cena przebija się poniżej dolnej linii Kanału Donchiana, wyświetla sygnał kupna (niebieska strzałka w górę ↑).
- Sygnał sprzedaży (kontrariański): Gdy cena przebija się powyżej górnej linii Kanału Donchiana, wyświetla sygnał sprzedaży (czerwona strzałka w dół ↓).
- Zarządzanie ryzykiem:
-
- Po wejściu rysowany jest początkowy Stop Loss (czerwona linia przerywana) oraz pierwszy Take Profit (zielona linia przerywana), oparte na ATR (Average True Range).
- Gdy pierwszy Take Profit (TP1) zostanie osiągnięty, pojawia się złota gwiazda (★), a stop loss jest przesuwany do ceny wejścia (break-even).
- Następnie aktywuje się oparty na ATR Trailing Stop, który zabezpiecza zyski, podążając za ceną. Ścieżka trailing stop jest wyświetlana jako linia magenta.
- Wyjścia z transakcji:
-
- Stop Loss: Jeśli cena osiągnie poziom stop-loss, jest to oznaczone czerwonym kwadratem (■).
- Wyjście z trailing stop: Jeśli cena osiągnie trailing stop, jest to oznaczone niebieskim kwadratem (■).
- Filtr ADX:
-
- Możesz opcjonalnie włączyć filtr ADX.
- Jeśli ADX jest wyższy niż określona wartość (wskazująca na silny trend), wyłączy nowe sygnały wejścia. Aktualny status (Entry OK / No Entry) jest wyświetlany w tekście w lewym górnym rogu wykresu.
Podsumowanie
AI summary
ScalperSignalVisual is a chart indicator designed to visualize the trading logic of the contrarian "Fade Breakout" strategy. It uses the Donchian Channel to generate entry signals: a buy signal appears when price breaks below the lower band, and a sell signal when price breaks above the upper band. The indicator does not execute trades but graphically demonstrates position management from entry to exit.
Key features include risk management tools based on the Average True Range (ATR). Upon entry, it plots an initial stop loss and a first take profit level. When the first take profit is reached, a marker appears and the stop loss moves to break-even. An ATR-based trailing stop then activates to protect profits, visually represented by a magenta line.
Trade exits are marked on the chart: a red square indicates a stop loss hit, and a blue square signals an exit via the trailing stop. An optional ADX filter can be enabled to suppress new entries during strong trending conditions, with the current entry status displayed on the chart.
This indicator aids traders by clearly illustrating the Fade Breakout strategy’s signals and trade management steps directly on price charts.
Key features include risk management tools based on the Average True Range (ATR). Upon entry, it plots an initial stop loss and a first take profit level. When the first take profit is reached, a marker appears and the stop loss moves to break-even. An ATR-based trailing stop then activates to protect profits, visually represented by a magenta line.
Trade exits are marked on the chart: a red square indicates a stop loss hit, and a blue square signals an exit via the trailing stop. An optional ADX filter can be enabled to suppress new entries during strong trending conditions, with the current entry status displayed on the chart.
This indicator aids traders by clearly illustrating the Fade Breakout strategy’s signals and trade management steps directly on price charts.
Profil wskaźnika
Opinie klientów
0.0
Opinie: 0
Opinie klientów
Ten produkt nie ma jeszcze opinii. Wypróbowałeś(-aś) go już? Bądź pierwszy(-a) i powiedz o tym innym!
Dyskusja
Częste pytania
Produkty dostępne za pośrednictwem cTrader Store, w tym boty handlowe, wskaźniki i wtyczki, dostarczane są przez deweloperów zewnętrznych i udostępniane wyłącznie w celach informacyjnych oraz w celu zapewnienia dostępu technicznego. cTrader Store nie jest brokerem i nie zapewnia doradztwa inwestycyjnego, nie udziela spersonalizowanych rekomendacji ani nie gwarantuje przyszłych wyników.
Więcej od tego autora



















Cena
1
Sprzedaż
1.91K
Bezpłatne instalacje