
Scalper Signal MTF
Indikator
253 muat turun
Versi 1.0, Aug 2025
Windows, Mac
Penerangan
Gambaran Keseluruhan
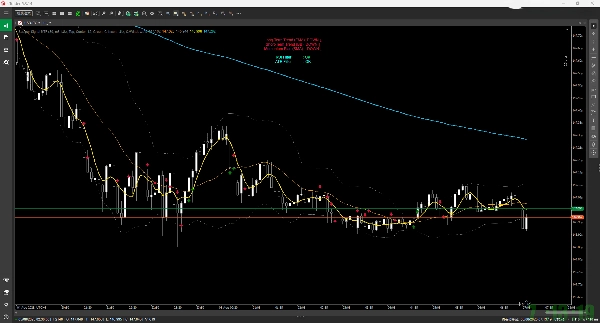
Berdasarkan penunjuk teknikal dari jangka masa tertentu (contohnya, 5 minit), ia memaparkan isyarat beli/jual (anak panah) pada carta semasa. Ia juga mensimulasikan perdagangan selepas isyarat muncul dan melukis tanda (bintang) di titik keluar yang berpotensi.
Ciri Utama
- Paparan Isyarat Beli/Jual:
-
- Isyarat Beli (Anak Panah Ke Atas): Berdasarkan persilangan emas SMA (Simple Moving Average), digabungkan dengan syarat dari RSI, 200 EMA, dan Bollinger Bands untuk mengenal pasti peluang pembelian yang menguntungkan.
- Isyarat Jual (Anak Panah Ke Bawah): Berdasarkan persilangan mati SMA, digabungkan dengan syarat dari RSI, 200 EMA, dan Bollinger Bands untuk mengenal pasti peluang penjualan yang menguntungkan.
- Simulasi Perdagangan:
-
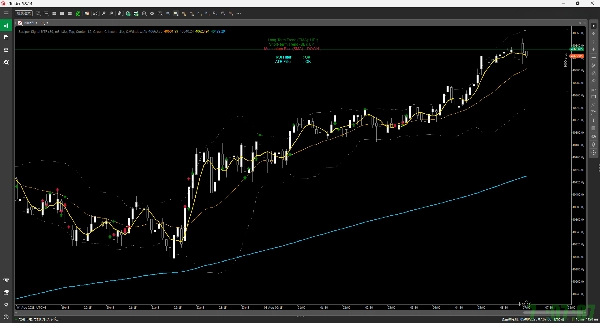
- Selepas isyarat, ia menganggap perdagangan ditutup jika mana-mana syarat berikut dipenuhi, dan menandakan carta dengan ikon bintang:
-
- Ambil Untung / Henti Rugi (berdasarkan ATR dan nisbah Risiko:Ganjaran yang ditetapkan).
- Menyentuh Bollinger Bands (jalur atas/bawah atau garis tengah).
- Melebihi masa pegangan maksimum.
- Breakeven dan hentian jejak juga dikira secara dalaman.
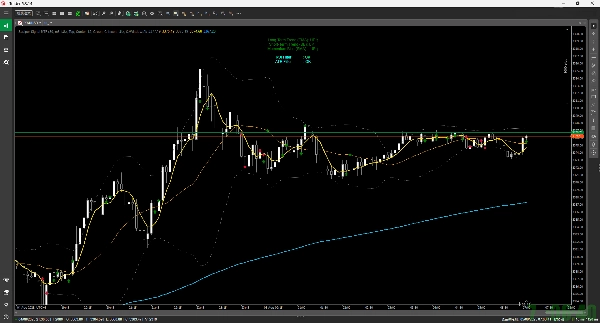
- Paparan Papan Pemuka:
-
- Memaparkan ringkasan mudah persekitaran pasaran semasa di bahagian kiri atas carta, termasuk trend jangka panjang (EMA), trend jangka pendek (BB), dan momentum (SMA).
- Fungsi Amaran:
-
- Menyediakan pemberitahuan bunyi apabila isyarat baru dijana.
Parameter
Anda boleh menyesuaikan dengan bebas item berikut dalam tetapan penunjuk:
- Jangka masa yang digunakan untuk pengiraan (MTF).
- Tempoh untuk pelbagai penunjuk (SMA, RSI, BB, EMA).
- Peraturan keluar perdagangan (contohnya, nisbah Risiko:Ganjaran, masa pegangan maksimum).
- Tetapan paparan untuk isyarat dan papan pemuka (keterlihatan, warna, saiz).
Ringkasan
Ringkasan AI
Scalper Signal MTF is a custom indicator designed for the cTrader platform that provides multi-timeframe scalping signals. It analyzes technical indicators from a chosen timeframe—such as 5 minutes—and displays buy (up arrow) and sell (down arrow) signals on the current chart. Buy signals are generated based on an SMA golden cross combined with RSI, 200 EMA, and Bollinger Bands conditions; sell signals use an SMA dead cross with similar criteria.
The indicator simulates trades after signals appear and marks potential exit points with a star icon. Trade exits are triggered by take profit or stop loss levels (calculated using ATR and a specified risk-reward ratio), touching Bollinger Bands, exceeding maximum holding time, or internal breakeven and trailing stop calculations.
A dashboard on the chart’s top-left summarizes the current market environment, showing long-term trend (EMA), short-term trend (Bollinger Bands), and momentum (SMA). The indicator also provides sound alerts when new signals occur.
Users can customize the timeframe for calculations, indicator periods (SMA, RSI, BB, EMA), trade exit rules, and display settings including signal and dashboard visibility, colors, and sizes.
Profil indikator
Ulasan pelanggan
0.0
Ulasan: 0
Ulasan pelanggan
Belum ada ulasan untuk produk ini. Anda sudah mencuba produk tersebut? Jadilah yang pertama untuk berkongsi pendapat anda!
Perbincangan
Soalan Lazim
Produk yang tersedia melalui cTrader Store, termasuk bot dagangan, indikator dan plugin, disediakan oleh pembangun pihak ketiga dan diberikan akses untuk tujuan maklumat dan teknikal sahaja. cTrader Store bukan broker dan tidak memberikan nasihat pelaburan, syor peribadi atau sebarang jaminan prestasi masa hadapan.
Lebih banyak produk daripada penulis ini


![Logo "[Stellar Strategies] Smart ADX"](https://cdn.ctrader.com/image/webp/af13b084-b6f6-41db-b7bc-c7e688b57b05_36929)


Harga
1
Jualan
1.34K
Pemasangan percuma