

ScalperSignalVisual
อินดิเคเตอร์
214 ดาวน์โหลด
เวอร์ชัน 1.0, Aug 2025
Windows, Mac

1
การขาย
1.92K
ติดตั้งฟรี
คำอธิบาย
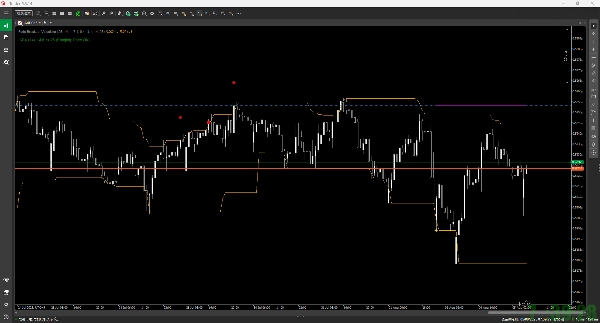
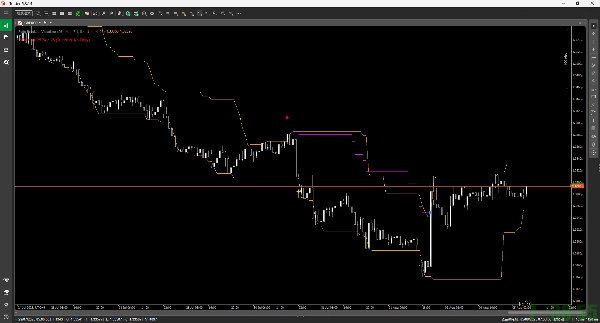
ตัวบ่งชี้นี้เป็นเครื่องมือสำหรับแสดงตรรกะการเทรดของกลยุทธ์ตรงข้ามที่เรียกว่า "Fade Breakout" บนแผนภูมิของคุณ มันไม่ได้ทำการเทรดจริง แต่แสดงให้เห็นว่าตำแหน่งจะถูกจัดการอย่างไรตั้งแต่เข้าจนถึงออกเมื่อเกิดสัญญาณ
คุณสมบัติหลัก
- สัญญาณเข้า:
-
- มันใช้ Donchian Channel.
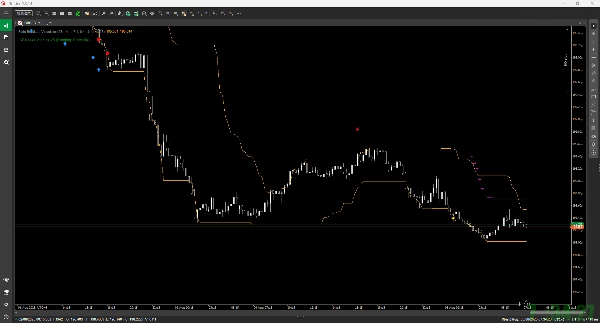
- สัญญาณซื้อ (ตรงข้าม): เมื่อราคาทะลุลงต่ำกว่าช่องล่างของ Donchian Channel จะแสดงสัญญาณซื้อ (ลูกศรขึ้นสีน้ำเงิน ↑)
- สัญญาณขาย (ตรงข้าม): เมื่อราคาทะลุขึ้นสูงกว่าช่องบนของ Donchian Channel จะแสดงสัญญาณขาย (ลูกศรลงสีแดง ↓)
- การจัดการความเสี่ยง:
-
- เมื่อเข้าเทรด จะมีการวาด Stop Loss เริ่มต้น (เส้นประสีแดง) และ Take Profit แรก (เส้นประสีเขียว) โดยอิงจาก ATR (Average True Range).
- เมื่อถึง Take Profit แรก (TP1) จะมีดาวสีทอง (★) ปรากฏขึ้น และ stop loss จะถูกเลื่อนไปยังราคาที่เข้าเทรด (จุดคุ้มทุน)
- หลังจากนั้น จะมี Trailing Stop ที่อิงจาก ATR ทำงานเพื่อรักษากำไรโดยติดตามราคา เส้นทางของ trailing stop จะแสดงเป็นเส้นสีม่วงแดง
- การออกจากการเทรด:
-
- Stop Loss: หากราคาถึงระดับ stop-loss จะถูกทำเครื่องหมายด้วยสี่เหลี่ยมสีแดง (■)
- Trailing Stop Exit: หากราคาถึง trailing stop จะถูกทำเครื่องหมายด้วยสี่เหลี่ยมสีน้ำเงิน (■)
- ตัวกรอง ADX:
-
- คุณสามารถเปิดใช้งานตัวกรอง ADX ได้ตามต้องการ
- ถ้า ADX สูงกว่าค่าที่กำหนด (บ่งชี้แนวโน้มที่แข็งแกร่ง) จะปิดการใช้งานสัญญาณเข้าใหม่ สถานะปัจจุบัน (เข้าได้ / ไม่เข้า) จะแสดงในข้อความที่มุมบนซ้ายของแผนภูมิ
สรุป
AI summary
ScalperSignalVisual is a chart indicator designed to visualize the trading logic of the contrarian "Fade Breakout" strategy. It uses the Donchian Channel to generate entry signals: a buy signal appears when price breaks below the lower band, and a sell signal when price breaks above the upper band. The indicator does not execute trades but graphically demonstrates position management from entry to exit.
Key features include risk management tools based on the Average True Range (ATR). Upon entry, it plots an initial stop loss and a first take profit level. When the first take profit is reached, a marker appears and the stop loss moves to break-even. An ATR-based trailing stop then activates to protect profits, visually represented by a magenta line.
Trade exits are marked on the chart: a red square indicates a stop loss hit, and a blue square signals an exit via the trailing stop. An optional ADX filter can be enabled to suppress new entries during strong trending conditions, with the current entry status displayed on the chart.
This indicator aids traders by clearly illustrating the Fade Breakout strategy’s signals and trade management steps directly on price charts.
Key features include risk management tools based on the Average True Range (ATR). Upon entry, it plots an initial stop loss and a first take profit level. When the first take profit is reached, a marker appears and the stop loss moves to break-even. An ATR-based trailing stop then activates to protect profits, visually represented by a magenta line.
Trade exits are marked on the chart: a red square indicates a stop loss hit, and a blue square signals an exit via the trailing stop. An optional ADX filter can be enabled to suppress new entries during strong trending conditions, with the current entry status displayed on the chart.
This indicator aids traders by clearly illustrating the Fade Breakout strategy’s signals and trade management steps directly on price charts.
โปรไฟล์อินดิเคเตอร์
รีวิวจากลูกค้า
0.0
รีวิว: 0
รีวิวจากลูกค้า
ยังไม่มีรีวิวสำหรับผลิตภัณฑ์นี้ หากเคยลองแล้ว ขอเชิญมาเป็นคนแรกที่บอกคนอื่น!
การสนทนา
คำถามที่พบบ่อย
ผลิตภัณฑ์ที่มีให้บริการผ่าน cTrader Store รวมถึงบอทการเทรด อินดิเคเตอร์ และปลั๊กอิน มีให้บริการโดยนักพัฒนาบุคคลที่สามและมีไว้เพื่อวัตถุประสงค์ในการเข้าถึงข้อมูลและทางเทคนิคเท่านั้น cTrader Store ไม่ใช่โบรกเกอร์และไม่ได้ให้คำแนะนำการลงทุน คำแนะนำส่วนบุคคล หรือการรับประกันผลการดำเนินงานในอนาคต
เพิ่มเติมจากผู้เขียนคนนี้



















ราคา
1
การขาย
1.92K
ติดตั้งฟรี