4 Currencies_NSC
Indikator
Versi 1.0, May 2025
Windows, Mac
4.6
Ulasan: 3
Deskripsi
Ringkasan
Ringkasan AI
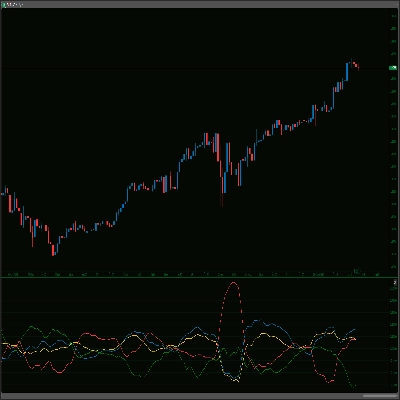
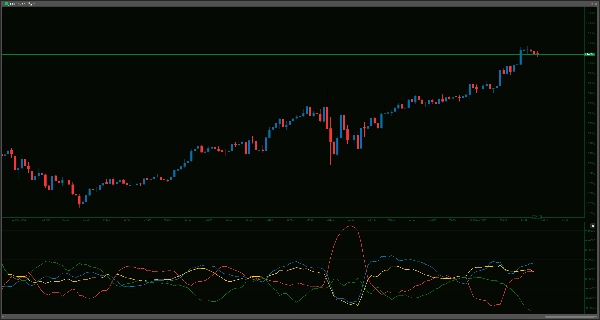
4 Currencies_NSC is a Relative Currency Strength indicator designed for Forex markets to measure and display the relative strength of four major currencies: AUD, USD, EUR, and JPY. It calculates each currency’s performance against a basket of others by analyzing pairs such as AUDUSD, AUDEUR, AUDJPY, EURUSD, EURJPY, and USDJPY over a user-defined lookback period. The indicator plots each currency’s strength as a separate line in a dedicated window below the main chart, providing clear visuals without cluttering price action.
Key features include adjustable LookbackPeriod (default 14 bars) for responsiveness or trend stability, and a SmoothingPeriod (default 5 bars) applying an exponential moving average to reduce noise. Calculations are based on bar closes, ensuring no repainting after bar completion. This tool aids in better currency pair selection by highlighting which currencies are strengthening or weakening, helps understand market drivers behind pair movements, and can be tailored to individual trading styles. It may require significant computing resources due to processing multiple pairs simultaneously.
Key features include adjustable LookbackPeriod (default 14 bars) for responsiveness or trend stability, and a SmoothingPeriod (default 5 bars) applying an exponential moving average to reduce noise. Calculations are based on bar closes, ensuring no repainting after bar completion. This tool aids in better currency pair selection by highlighting which currencies are strengthening or weakening, helps understand market drivers behind pair movements, and can be tailored to individual trading styles. It may require significant computing resources due to processing multiple pairs simultaneously.
Profil indikator
Ulasan pelanggan
4.6
Ulasan: 3
5 | 67 % | |
4 | 33 % | |
3 | 0 % | |
2 | 0 % | |
1 | 0 % |
Ulasan pelanggan
June 9, 2025
The signal still needs a chart check, no surprise there. The setup needs patience.
June 4, 2025
Diskusi
Pertanyaan umum
Forex
EURUSD
USDJPY
Produk-produk yang tersedia melalui cTrader Store, termasuk bot trading, indikator, dan plugin, disediakan oleh pengembang pihak ketiga serta hanya ditujukan untuk akses teknis dan informasi. cTrader Store bukan broker dan tidak menyediakan saran investasi, rekomendasi pribadi, atau jaminan apa pun tentang kinerja di masa mendatang.


![Logo "High-Low Divergence [Iridio Capital]"](https://cdn.ctrader.com/image/webp/443c4661-7abb-40f1-842f-4b6ec560649b_40914)


Harga
Sejak 14/01/2025
55
Penjualan
11.53K
Instal gratis