
Opis
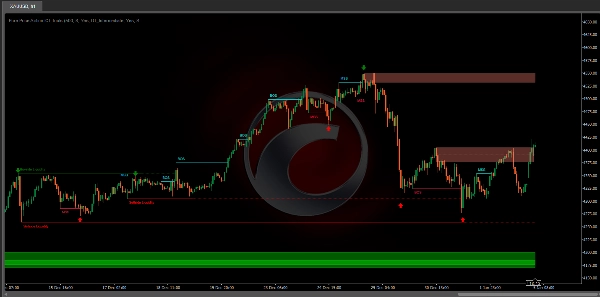
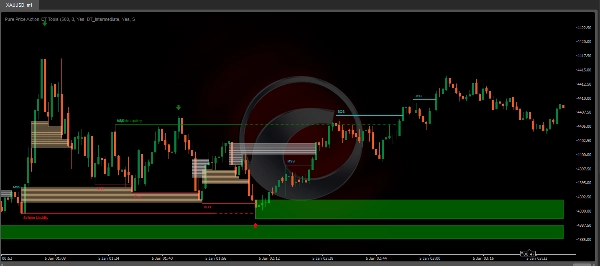
Wskaźnik Pure Price Action ICT Tools jest zaprojektowany do analizy czystego ruchu cenowego, automatycznie identyfikując struktury rynkowe w czasie rzeczywistym, poziomy płynności, bloki zleceń i przełamań oraz luki płynności.
Jego unikalną cechą jest wyłączne poleganie na wzorcach cenowych, bez ograniczeń wynikających z jakichkolwiek zdefiniowanych przez użytkownika parametrów, co zapewnia solidną i obiektywną analizę dynamiki rynku.
Kluczowe cechy
- Struktury rynkowe
Zmiana struktury rynku, znana również jako zmiana charakteru (CHoCH), to kluczowe zdarzenie w analizie ruchu cenowego, wskazujące na potencjalną zmianę nastrojów lub kierunku rynku. MSS występuje, gdy cena odwraca się od ustalonego trendu, sygnalizując, że dominujący trend może tracić impet i może nastąpić odwrócenie. Ta zmiana jest często identyfikowana przez kluczowe wzorce techniczne, takie jak wyższe minimum w trendzie spadkowym lub niższe maksimum w trendzie wzrostowym, które wskazują na osłabienie siły obecnego trendu.
Przełamanie struktury (Break of Structure) zazwyczaj wskazuje na kontynuację obecnego trendu rynkowego. Zdarzenie to ma miejsce, gdy cena zdecydowanie przekracza poprzedni szczyt lub dołek, potwierdzając siłę dominującego trendu. W trendzie wzrostowym BOS oznacza przebicie ceny powyżej poprzedniego maksimum, natomiast w trendzie spadkowym jest to przebicie ceny poniżej poprzedniego minimum.
Chociaż zmiana struktury rynku (MSS) może wskazywać na potencjalne odwrócenie trendu, a przełamanie struktury (BOS) często potwierdza kontynuację trendu, nie gwarantują one całkowitego odwrócenia lub kontynuacji. Poziomy MSS i BOS mogą również pełnić funkcję stref płynności lub obszarów konsolidacji cen, zamiast jednoznacznie sygnalizować zmianę kierunku rynku. Traderzy powinni podchodzić do tych sygnałów ostrożnie i weryfikować je za pomocą dodatkowych czynników przed podjęciem decyzji handlowych. Szczegóły dotyczące innych elementów narzędzia znajdują się w kolejnych sekcjach.
- Bloki zleceń i przełamań
Bloki zleceń i przełamań to kluczowe pojęcia w analizie ruchu cenowego, które pomagają traderom identyfikować istotne poziomy w strukturze rynku.
Bloki zleceń to konkretne strefy cenowe, gdzie miała miejsce znaczna aktywność kupna lub sprzedaży. Strefy te często reprezentują działania dużych instytucjonalnych traderów lub animatorów rynku, którzy realizują znaczne zlecenia wpływające na rynek.
Bloki przełamań to konkretne strefy cenowe, gdzie następuje silne odwrócenie, powodujące przerwanie dominującej struktury rynku. Bloki te wskazują obszary, gdzie cena napotkała istotny opór lub wsparcie, prowadząc do odwrócenia.
Podsumowując, płynność po stronie kupujących i sprzedających dostarcza kluczowych informacji o dynamice popytu i podaży na rynku, pomagając traderom podejmować świadome decyzje na podstawie dostępności zleceń na różnych poziomach cenowych.
- Płynność po stronie kupujących i sprzedających
Zarówno strefy płynności po stronie kupujących, jak i sprzedających są kluczowe dla identyfikacji potencjalnych punktów zwrotnych na rynku. Strefy te to miejsca, gdzie skoncentrowane jest znaczące zainteresowanie kupnem lub sprzedażą, wpływając na przyszłe ruchy cen.
Podsumowując, płynność po stronie kupujących i sprzedających dostarcza kluczowych informacji o dynamice popytu i podaży na rynku, pomagając traderom podejmować świadome decyzje na podstawie dostępności zleceń na różnych poziomach cenowych.
- Luki płynności
Luki płynności to przerwy lub obszary na wykresie cenowym, gdzie brak jest aktywności handlowej. Luki te reprezentują strefy z minimalną lub zerową liczbą zleceń kupna lub sprzedaży, co często skutkuje gwałtownymi ruchami cen, gdy rynek wchodzi w te obszary.
Podsumowując, luki płynności to kluczowe obszary na wykresie cenowym charakteryzujące się brakiem aktywności handlowej. Luki te mogą prowadzić do szybkich ruchów cen i zwiększonej zmienności, co czyni je istotnym elementem analizy i podejmowania decyzji przez traderów.
- Punkty zwrotne
Punkty odwrócenia cen są powszechnie nazywane punktami zwrotnymi. Traderzy często analizują historyczne punkty zwrotne, aby rozpoznać trendy rynkowe i określić potencjalne punkty wejścia i wyjścia z transakcji.
Należy zauważyć, że w tym skrypcie podlegają one malowaniu wstecznemu, co oznacza, że nie są zlokalizowane tam, gdzie są wykrywane.
Wykrywanie punktów zwrotnych oraz unikalna cecha tego skryptu opierają się wyłącznie na ruchu cenowym, eliminując potrzebę numerycznych ustawień definiowanych przez użytkownika. Proces rozpoczyna się od wykrywania krótkoterminowych punktów zwrotnych:
- Krótkoterminowy szczyt zwrotny (STH): Identyfikowany jako szczyt cenowy otoczony niższymi szczytami po obu stronach.
- Krótkoterminowe dno zwrotne (STL): Rozpoznawane jako dołek cenowy otoczony wyższymi dołkami po obu stronach.
Punkty zwrotne średnioterminowe i długoterminowe wykrywane są za pomocą tego samego podejścia, ale z niewielką modyfikacją. Zamiast bezpośrednio analizować świece cenowe, wykorzystywane są wcześniej wykryte krótkoterminowe punkty zwrotne. Dla punktów średnioterminowych analizowane są punkty krótkoterminowe, natomiast dla punktów długoterminowych wykorzystywane są punkty średnioterminowe.
Ta metoda zapewnia solidną i obiektywną analizę dynamiki rynku, oferując traderom wiarygodne informacje o strukturach rynkowych. Wykryte punkty zwrotne stanowią podstawę do identyfikacji struktur rynkowych, poziomów płynności po stronie kupujących/sprzedających oraz bloków zleceń i przełamań prezentowanych w tym narzędziu.
Podsumowując, punkty zwrotne są istotnymi elementami analizy technicznej, pomagając traderom identyfikować trendy, poziomy wsparcia i oporu oraz optymalne punkty wejścia i wyjścia. Zrozumienie punktów zwrotnych pozwala traderom podejmować świadome decyzje oparte na naturalnych ruchach cen na rynku.
Ustawienia
- Struktury rynkowe
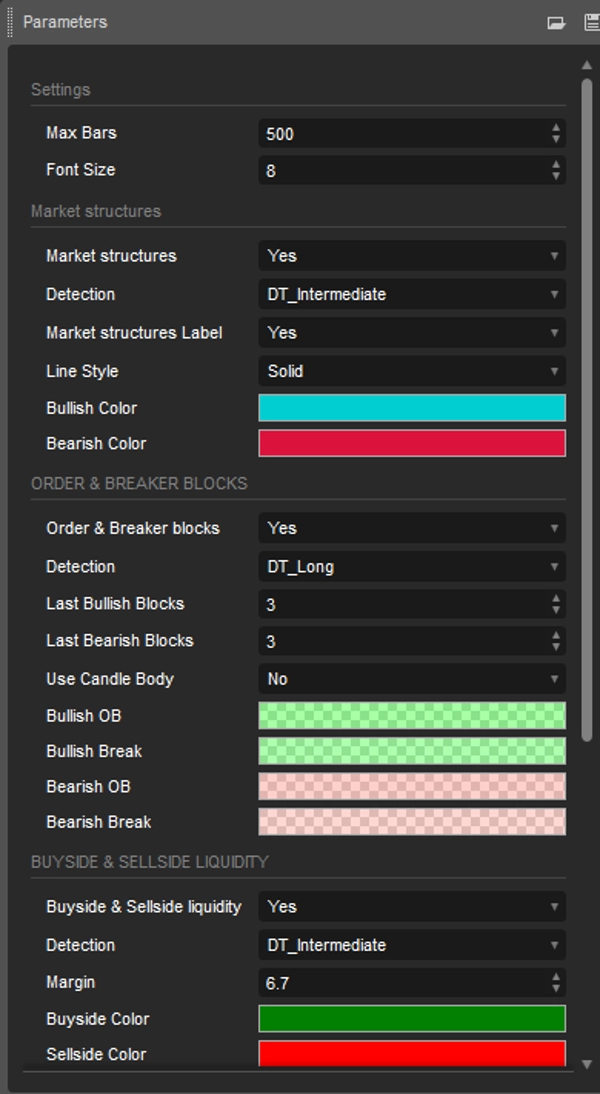
Struktury rynkowe: Przełącza widoczność struktur rynkowych, zarówno zmian, jak i przełamań.
Wykrywanie: Opcja pozwalająca użytkownikom na wykrywanie struktur rynkowych na podstawie znaczenia poziomów zwrotnych, w tym krótkoterminowych, średnioterminowych i długoterminowych.
Etykiety struktur rynkowych: Kontroluje widoczność etykiet podkreślających typ struktury rynkowej.
Styl linii: Dostosowuje styl linii reprezentujących strukturę rynku.
- Bloki zleceń i przełamań
Bloki zleceń i przełamań: Przełącza widoczność bloków zleceń i przełamań.
Wykrywanie: Opcja pozwalająca użytkownikom na wykrywanie bloków zleceń i przełamań na podstawie znaczenia poziomów zwrotnych, w tym krótkoterminowych, średnioterminowych i długoterminowych.
Ostatnie bycze bloki: Liczba najnowszych byczych bloków zleceń/przełamań do wyświetlenia na wykresie.
Ostatnie niedźwiedzie bloki: Liczba najnowszych niedźwiedzich bloków zleceń/przełamań do wyświetlenia na wykresie.
Użyj korpusu świecy: Pozwala użytkownikom używać korpusów świec jako obszarów bloków zleceń zamiast pełnego zakresu świecy.
- Płynność po stronie kupujących i sprzedających
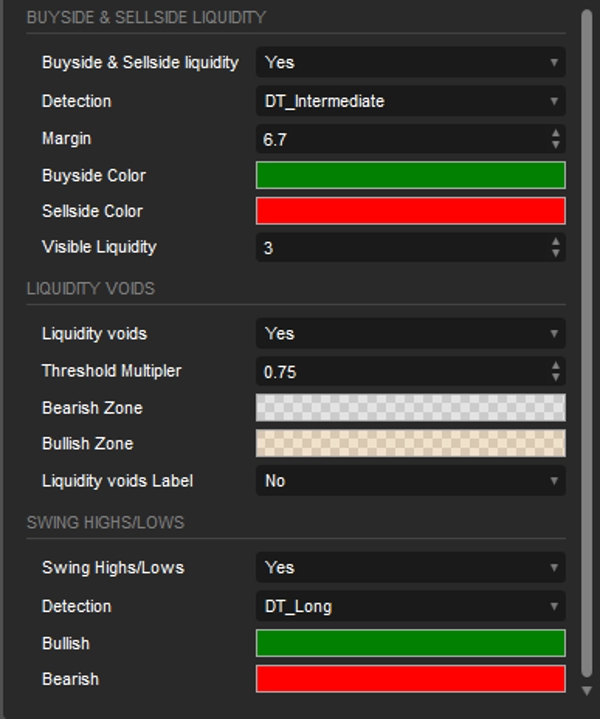
Płynność po stronie kupujących i sprzedających: Przełącza widoczność poziomów płynności po stronie kupujących i sprzedających.
Wykrywanie: Opcja pozwalająca użytkownikom na wykrywanie płynności po stronie kupujących i sprzedających na podstawie znaczenia poziomów zwrotnych, w tym krótkoterminowych, średnioterminowych i długoterminowych.
Margines: Ustawia margines/czułość dla wykrywania poziomu płynności.
Widoczna płynność: Kontroluje ilość poziomów/stref płynności do wizualizacji.
- Luki płynności
Luki płynności: Włącza wyświetlanie zarówno byczych, jak i niedźwiedzich luk płynności.
Mnożnik progu: Definiuje mnożnik dla progu, który jest na stałe powiązany z zakresem ATR z 200 okresów.
Etykieta: Włącza wyświetlanie etykiety wskazującej luki płynności.
- Punkty zwrotne
Szczyty/dołki zwrotne: Przełącza widoczność poziomów zwrotnych.
Wykrywanie: Opcja pozwalająca użytkownikom na wykrywanie poziomów zwrotnych na podstawie znaczenia poziomów zwrotnych, w tym krótkoterminowych, średnioterminowych i długoterminowych.
Podsumowanie
Key functionalities include:
- Market Structures: Detects Market Structure Shifts (potential trend reversals) and Breaks of Structure (trend continuations) based on price patterns.
- Order & Breaker Blocks: Highlights significant price zones where institutional buying/selling or strong reversals occur.
- Buy-side & Sell-side Liquidity: Identifies zones of concentrated buying or selling interest that may influence price movements.
- Liquidity Voids: Marks price chart gaps with minimal trading activity, often leading to sharp price moves.
- Swing Points: Detects short-, intermediate-, and long-term reversal points to aid in trend analysis and trade decision-making.
The tool offers customizable settings to toggle visibility and detection sensitivity for each feature, including options to adjust detection based on swing level significance and display preferences. It supports analysis across various markets such as Forex, Crypto (e.g., BTCUSD), and indices (e.g., NAS100, XAUUSD). The indicator provides an objective framework for analyzing market dynamics based solely on price action patterns.
Opinie klientów
5 | 67 % | |
4 | 0 % | |
3 | 33 % | |
2 | 0 % | |
1 | 0 % |


