

Opis
Ci, którzy zajmują się handlem, wiedzą, jak ważne jest uwzględnienie poprzedniej sesji.
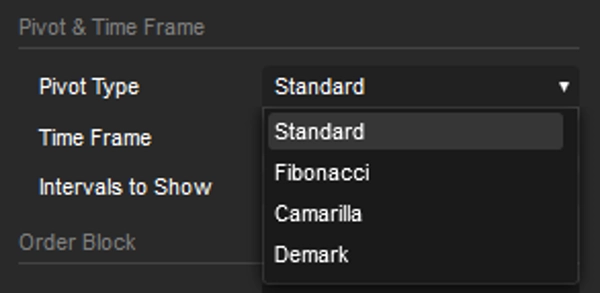
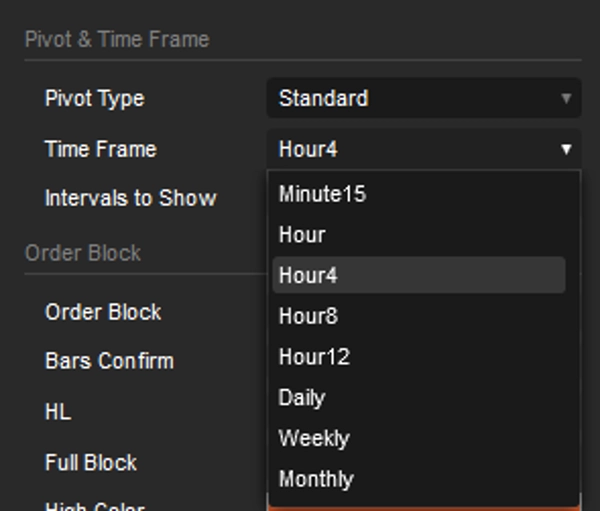
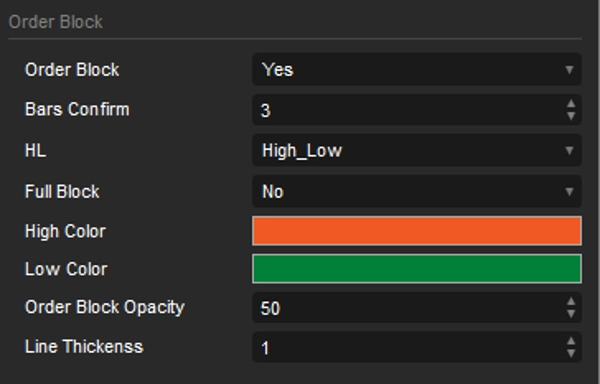
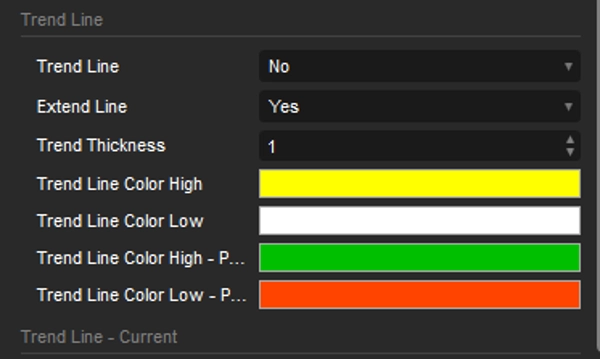
Przygotowałem ten wskaźnik Pivot, z interwałami od 15 minut do miesiąca, który zawiera bloki zleceń i linie trendu. Obie opcje opierają się na najwyższych i najniższych punktach poprzedniej sesji.
Domyślna konfiguracja jest ustawiona na ramę czasową 5 minut.
Pivot jest ustawiony na 4 godziny, a interwał na 5, co oznacza, że patrzy wstecz na 20 godzin w 4-godzinnych interwałach. To idealne rozwiązanie dla tych, którzy handlują codziennie.
Jeśli jednak jesteś fanem Swing Tradingu, wystarczy zmienić interwał Pivot; wszystko inne dostosowuje się automatycznie.
Bloki zleceń podkreślają potencjalne obszary, gdzie cena może znaleźć wsparcie lub opór, oferując wgląd w możliwe odwrócenia lub kontynuacje. Łącząc je z automatycznie generowanymi liniami trendu dla wybranej ramy czasowej, traderzy mogą dokładniej określić potencjalny kierunek ceny oraz możliwe punkty wejścia lub wyjścia. Możliwość wizualizacji tych linii trendu na wielu ramach czasowych zapewnia pełniejsze zrozumienie struktury rynku.
Z dodatkowymi narzędziami takimi jak
OrderPrice V3 https://ctrader.com/products/397
NTMPICLL https://ctrader.com/products/327
Range Box Level https://ctrader.com/products/245
Or RangeBoxFibonacci https://ctrader.com/products/526
Market Session https://ctrader.com/products/94
MacdVolume https://ctrader.com/products/267
4MA https://ctrader.com/products/247
Będziesz niepokonany
Powodzenia 😀
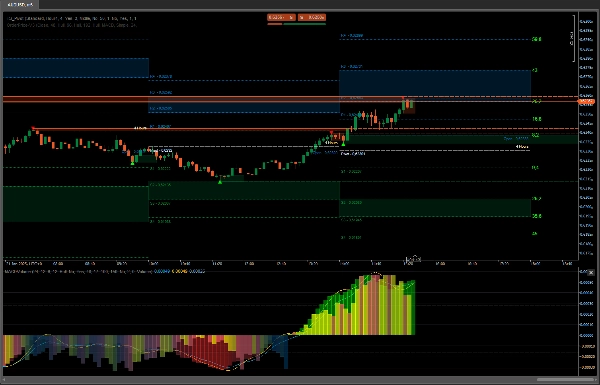
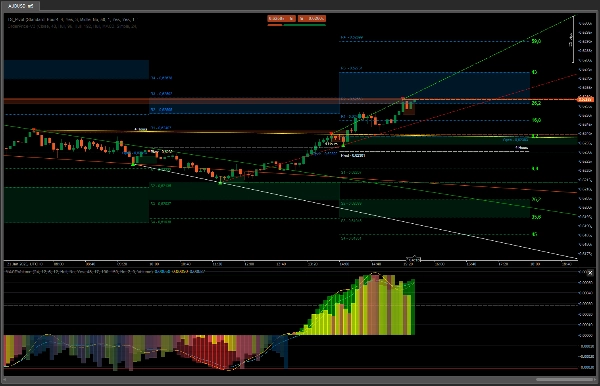
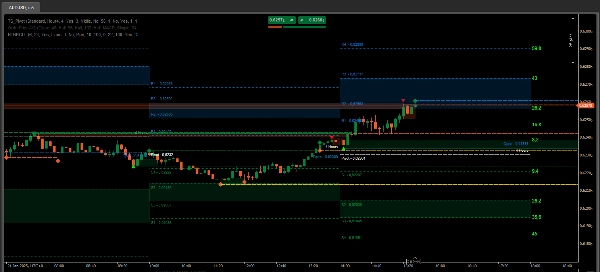
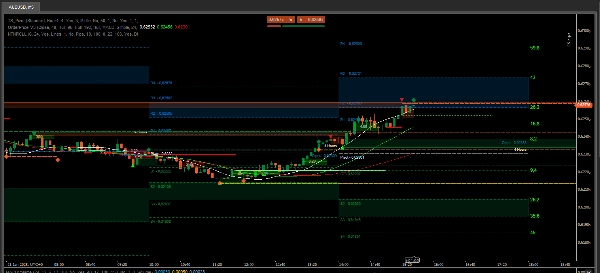
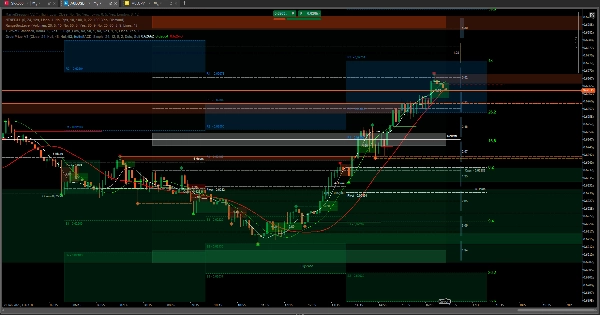
W przypadku kupna, obserwując na dwóch ostatnich obrazach zachowanie OrderPrice i wbudowanych średnich kroczących, gdy pojawia się zielona linia, a średnia krocząca jest poniżej, to idealny moment na otwarcie transakcji kupna.
Dzięki danym z poprzedniej sesji możesz określić, jak daleko cena może się posunąć lub gdzie może wystąpić opór. Jeśli przebije się przez ten poziom, może kontynuować do drugiego punktu, którym może być strefa neutralna RangeBoxLevel. Jeśli ją przekroczy i nie ma oznak, że średnie kroczące chcą zmienić kierunek, cena może dotrzeć do strefy bloków zleceń z poprzedniej sesji.
Na ostatnim obrazku znajduje się zrzut ekranu idealnej sytuacji do wejścia i wyjścia z transakcji. Reszta to tylko obserwacja i wyciąganie wniosków.
Te narzędzia są niezbędne, jeśli chodzi o wygrywanie poprzez handel aktywami.
Podsumowanie
Key features include the integration of order blocks and trend lines derived from previous session data. Order blocks identify potential support and resistance zones, aiding in spotting possible price reversals or continuations. The indicator automatically generates trend lines for the selected timeframe, helping traders assess market structure and potential price direction. Visualizing these trend lines across multiple timeframes enhances market analysis.
TS_Pivot can be used alongside complementary tools such as OrderPrice V3, NTMPICLL, Range Box Level, RangeBoxFibonacci, Market Session, MacdVolume, and 4MA to refine entry and exit decisions. By combining moving averages and order block signals, traders can identify optimal moments to open buy or sell positions. The indicator supports various markets including Forex, cryptocurrencies, commodities, indices, and stocks.
Opinie klientów
5 | 100 % | |
4 | 0 % | |
3 | 0 % | |
2 | 0 % | |
1 | 0 % |


![Logo „[Hamster-Coder] Bollinger Bands”](https://cdn.ctrader.com/image/webp/21d8e5d6-fb11-4bac-b9ee-cd05c2b76804_30327)


![Logo „High-Low Divergence [Iridio Capital]”](https://cdn.ctrader.com/image/webp/443c4661-7abb-40f1-842f-4b6ec560649b_40914)