
Opis
Support & Resistance Pro identyfikuje strefy wsparcia i oporu oraz — w przeciwieństwie do większości narzędzi S/R — mierzy, czy te strefy faktycznie działają, korzystając z niezależnego silnika statystycznego opartego na rzeczywistych danych historycznych, a nie na założeniach. Każda strefa pokazuje statystykę wskaźnika utrzymania z przedziałem ufności, obliczoną na podstawie pełnej populacji historycznych stref, w tym stref, które później zostały przebite i zniknęły z wykresu. Większość wskaźników w tej kategorii liczy tylko poziomy widoczne obecnie, co cicho zawyża każde twierdzenie o sile. Ten tego nie robi.
Kluczowe funkcje
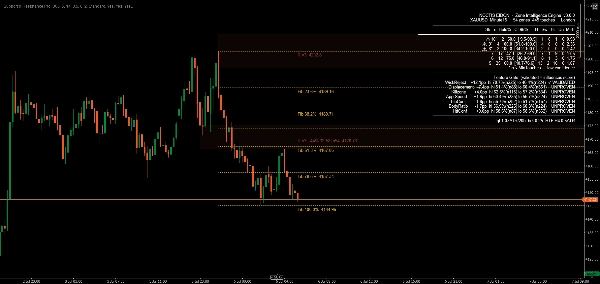
- Statystycznie zweryfikowane strefy Każda strefa posiada rzeczywisty, historycznie zmierzony wskaźnik utrzymania z 95% przedziałem ufności — nie jest to przypuszczalna ocena siły. Jeden sygnał, odrzucenie knota w punkcie kontaktu, został formalnie zweryfikowany: potwierdzony na EURUSD i Bitcoinie, na wielu ramach czasowych, w tym w prawdziwym teście poza próbką, gdzie efekt utrzymał siłę na niewidzianych danych.
- Automatyczna zmiana roli Przebite wsparcie automatycznie staje się oporem i odwrotnie, z wyraźnym wizualnym oznaczeniem — wskaźnik śledzi, po której stronie ceny znajduje się strefa i koloruje ją odpowiednio, zamiast przypisywać kolor według pierwotnego powstania strefy.
- Zbieżność z wyższą ramą czasową Strefy na twoim wykresie są sprawdzane względem wyższej ramy czasowej wybranej przez ciebie, z dopasowaną strukturą HTF rysowaną bezpośrednio na wykresie jako oddzielna nakładka wizualna.
- Integracja zniesień Fibonacciego Automatyczne poziomy zniesień Fibonacciego z ostatniego ruchu, każdy oznaczony zarówno stosunkiem, jak i dokładną ceną z precyzją twojego brokera, automatycznie odciążone względem pobliskich stref, aby etykiety nigdy się nie nakładały.
- Ostrzeżenie o nasyceniu Strefy testowane zbyt wiele razy są oznaczane, a nie zakładane jako silniejsze — nasze dane pokazują, że mocno testowane strefy mają tendencję do gorszego działania, prawdopodobnie dlatego, że ich dostępna płynność została już wykorzystana.
- Otwarte bramki walidacji Sześć dodatkowych kandydatów na sygnały — stosunek ciała, prędkość podejścia, czas sesji/strefy zabójczej oraz testowanie przesunięcia — są wyświetlane na żywo na wbudowanym panelu statystyk z własnymi odczytami wskaźnika utrzymania. Nie wpływają na żadną ocenę ani ranking, dopóki każdy z nich niezależnie nie spełni tego samego poziomu dowodu, co odrzucenie knota. Widzisz dokładnie, co jest udowodnione, a co nie.
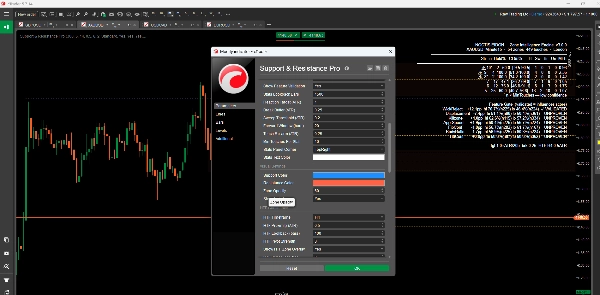
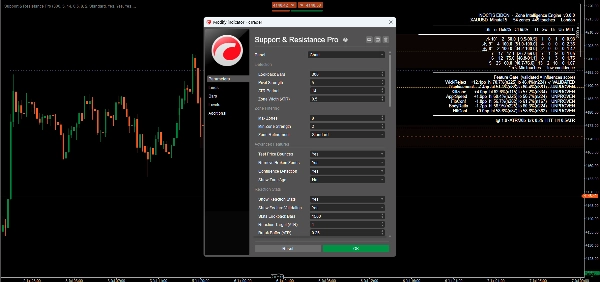
- Konfigurowalne ustawienia Rozbudowana kontrola parametrów w zakresie czułości wykrywania, filtrowania stref, stylizacji wizualnej i zachowania alertów.
- Alerty w czasie rzeczywistym Konfigurowalne alerty wyskakujące, e-mailowe i dźwiękowe dla dotknięć stref, wybicia i zdarzeń zbieżności, niezależnie włączane dla każdego kanału.
Korzyści
- Dowód zamiast założeń: każda statystyka na wykresie może być niezależnie sprawdzona — wskaźnik zawiera własne narzędzia weryfikacji próbkowej i poza próbką
- Brak błędu przeżywalności: twierdzenia o sile opierają się na pełnej populacji historycznych stref, a nie tylko na poziomach, które przetrwały
- Uczciwe ujawnienie: sygnały potwierdzone i niepotwierdzone są oznaczone jako takie, na wykresie, przez cały czas
Idealne dla
Traderów, którzy chcą zobaczyć statystyczne dowody stojące za poziomem, a nie tylko linię — day traderów, swing traderów i traderów systematycznych na rynku forex, kryptowalut i innych instrumentów, poszukujących rygorystycznie zmierzonego podejścia do wsparcia i oporu.
Podsumowanie
Support & Resistance Pro opiera się na jednej zasadzie: twierdzenie o sile nie jest prawdziwe, dopóki nie zostanie zmierzone. Jeden sygnał przeszedł ten próg z potwierdzeniem międzyinstrumentowym, międzyramowym i poza próbką. Reszta jest uczciwie pokazywana jako nadal testowana — ponieważ liczba, której nie możesz zweryfikować, nie jest warta pokazywania wcale.
Podsumowanie
- Dynamic support and resistance levels that adjust in real-time based on recent price action.
- Multi-timeframe analysis to view levels across different timeframes for a comprehensive market overview.
- Calculation and display of pivot points to mark potential intraday reversal zones and target prices.
- Highlighting of psychological price levels (round numbers) to gauge market sentiment.
- Integration of Fibonacci retracement levels to assist in identifying support and resistance during price corrections.
- Customizable settings for lookback periods, visualization styles, and color schemes to suit individual trading preferences.
- Clear graphical representation for easy identification of market conditions.
- Configurable real-time alerts when prices approach critical levels.
This indicator supports various trading styles including scalping, day trading, and swing trading, and is suitable for traders in forex, commodities, stocks, and indices markets. It is intended for both beginner and experienced traders seeking structured market analysis and enhanced decision-making through reliable support and resistance data.
Opinie klientów
5 | 100 % | |
4 | 0 % | |
3 | 0 % | |
2 | 0 % | |
1 | 0 % |


