
Opis
SmartFibonacci — automatyczne, konfigurowalne poziomy zniesień i rozszerzeń Fibonacciego z obsługą wyższych interwałów czasowych, etykietami cen i alertami bliskości dla szybszych i pewniejszych decyzji handlowych.
Gotowy do sklepu krótki opis (1–2 linie)
SmartFibonacci automatycznie wykrywa punkty swing high/low i rysuje wyraźne poziomy zniesień Fibonacciego oraz opcjonalne rozszerzenia na Twoim wykresie. Konfigurowalny okres wstecz, wykrywanie swingów na wyższych interwałach, oznaczone ceny/procenty oraz alerty bliskości czynią go idealnym zarówno do skalpowania intraday, jak i ustawień swingowych.
Pełny opis produktu (gotowy do kopiowania i wklejania do sklepu cTrader)
SmartFibonacci to lekki, wydajny wskaźnik cTrader, który automatyzuje analizę Fibonacciego, dzięki czemu możesz spędzać mniej czasu na rysowaniu poziomów, a więcej na handlu. Lokalizuje najnowszy swing high i swing low w konfigurowalnym okresie wstecz, rysuje poziomy zniesień i opcjonalne poziomy projekcji (rozszerzenia) oraz wyświetla etykiety cen i procentów dla szybkiej interpretacji. Dla solidnych sygnałów SmartFibonacci może obliczać punkty swing na wyższym interwale czasowym, podczas gdy poziomy są renderowane na Twoim aktualnym wykresie. Wbudowane alerty (popup + dźwięk) powiadamiają, gdy cena zbliża się na konfigurowalną odległość pip do dowolnego widocznego poziomu Fibonacciego.
Ta oferta zawiera: wyraźne zrzuty ekranu pokazujące kluczowe elementy interfejsu użytkownika, przykładowe przepływy pracy, ustawienia konfiguracyjne oraz przykładowe wyniki (etykiety cen, rozszerzenia, alerty), aby ułatwić kupującym ocenę funkcjonalności i UX przed zakupem.
Kluczowe cechy
- Automatyczne wykrywanie swingów — znajduje najnowszy swing high/low w konfigurowalnym oknie wstecz.
- Opcja wyższego interwału czasowego — oblicza punkty pivot swing na wyższym interwale dla gładszych, bardziej znaczących poziomów.
- Zniesienia i rozszerzenia — rysuje standardowe linie zniesień oraz opcjonalne poziomy projekcji (rozszerzenia) (definiowane przez użytkownika procenty takie jak 127.2, 161.8 itd.).
- Etykiety cen i procentów — każdy widoczny poziom pokazuje swój procent i dokładną cenę dla szybkiego podejmowania decyzji.
- Konfigurowalne wizualizacje — ustaw kolory (zniesienia / rozszerzenia), grubość linii i styl linii.
- Alerty bliskości — popup + dźwięk, gdy cena wchodzi w konfigurowalny promień pip od widocznego poziomu Fibonacciego; opcja alertu tylko najbliższego poziomu.
- Efektywna logika przerysowywania — wskaźnik przerysowuje się tylko, gdy zmieniają się punkty pivot swing, aby zmniejszyć zagracenie wykresu i zużycie CPU.
- Bezpieczne ustawienia domyślne — rozsądne ustawienia domyślne dla traderów, którzy chcą natychmiastowego użycia po instalacji.
- Kompatybilny z cTrader / cAlgo — zaprojektowany do działania jako wskaźnik nakładkowy.
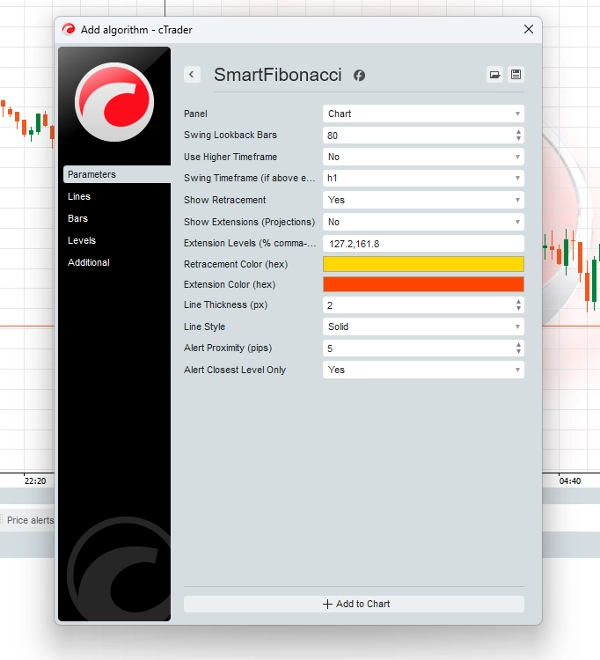
Konfiguracja (parametry i wyjaśnienia)
- Liczba świec do analizy swingów (int) — ile świec wstecz szukać swing high/low (domyślnie 80).
- Użyj wyższego interwału (bool) — włącz wykrywanie na wyższym TF podczas rysowania na aktualnym wykresie.
- Interwał swingów (TimeFrame) — wyższy interwał czasowy do użycia, gdy
Use Higher Timeframejest włączony. - Pokaż zniesienia (bool) — przełącz rysowanie poziomów zniesień.
- Pokaż rozszerzenia (bool) — przełącz rysowanie poziomów rozszerzeń/projekcji.
- Poziomy rozszerzeń (string) — wartości procentowe oddzielone przecinkami (np.
127.2,161.8) używane do tworzenia linii projekcji. - Kolor zniesień / kolor rozszerzeń (hex) — wybierz kolory dla linii zniesień i rozszerzeń.
- Grubość linii (px) — ustawienie grubości linii jako liczba całkowita.
- Styl linii (enum) — wybierz ciągły, przerywany itd.
- Alert bliskości (pipsy) — odległość w pipsach dla alertów bliskości.
- Alert tylko najbliższego poziomu (bool) — po włączeniu tylko najbliższy poziom fib wywołuje popup.
Wyniki analityczne i elementy UX
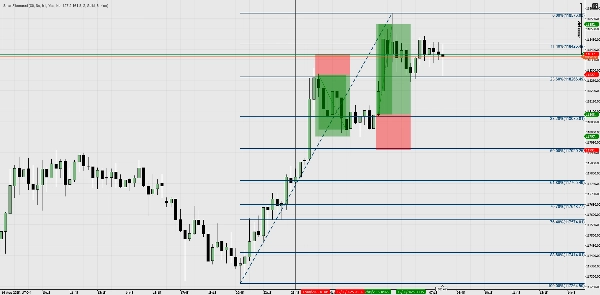
- Linie na wykresie — linie zniesień i rozszerzeń z wyraźnymi etykietami procentowymi (np. 61.8%) i cenowymi (np. 1.23456).
- Powiadomienia popup — użytkownik otrzymuje popup na ekranie i dźwięk systemowy, gdy cena wchodzi w obszar
Alert Proximity. - Nieinwazyjne przerysowywanie — aktualizuje się tylko, gdy wykryty swing się zmienia, aby uniknąć częstego migotania przerysowań.
- Spójność źródła cen — alerty i etykiety są obliczane przy użyciu tej samej serii świec, na której rysowano fib (ważne przy używaniu obliczeń na wyższym interwale).
Przykładowe przepływy pracy / scenariusze użycia
- Szybka konfiguracja (skalpowanie / intraday)
-
- Dołącz SmartFibonacci do wykresu 5-minutowego, ustaw
Lookback = 80,ShowRetrace = true. - Obserwuj poziomy zniesień i używaj 61.8% / 50% jako stref reakcji intraday.
- Włącz
Alert Proximity = 5 pips, aby otrzymywać powiadomienia, gdy cena zbliża się do ważnych poziomów.
- Dołącz SmartFibonacci do wykresu 5-minutowego, ustaw
- Kontekst wyższego interwału (swing trading)
-
- Ustaw
Use Higher Timeframe = truei wybierzHigher Timeframe = H4(lub Daily). - Poziomy odzwierciedlają swingi H4, podczas gdy handlujesz na H1 lub M30 — lepsze dopasowanie do struktury wyższego TF.
- Używaj rozszerzeń (127.2, 161.8) jako celów zysku dla swingów.
- Ustaw
- Walidacja + konfluencja
-
- Łącz poziomy SmartFibonacci z istniejącym wsparciem/oporem, przerwami struktury lub średnimi kroczącymi, aby potwierdzić wejścia.
- Używaj alertów popup, aby wyznaczać czas wejść lub prowadzić dziennik interakcji do testów historycznych.
- Przepływy pracy oparte na alertach
-
- Trzymaj wskaźnik włączony podczas monitorowania wielu wykresów; otrzymuj popupy, gdy cena zbliża się do dowolnego skonfigurowanego widocznego poziomu fib i działaj odpowiednio.
Podsumowanie
Opinie klientów
5 | 100 % | |
4 | 0 % | |
3 | 0 % | |
2 | 0 % | |
1 | 0 % |


![Logo „[Stellar Strategies] Market Session Ultimate”](https://cdn.ctrader.com/image/webp/61ffd537-0125-4246-9e72-42eca1791d64_28232)


