
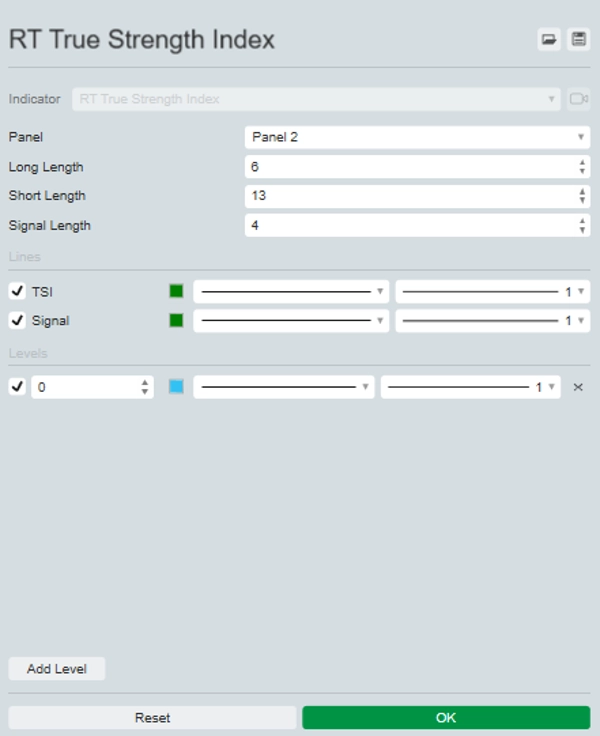
Przedstawiamy wskaźnik True Strength Index (TSI), potężne narzędzie zaprojektowane, aby wzbogacić Twoją strategię handlową, dostarczając jasnych informacji o momentum rynku i sile trendu.
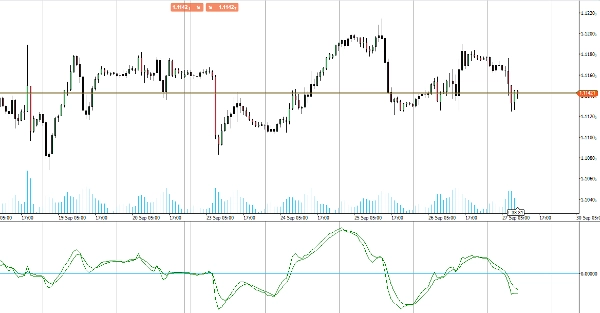
Wskaźnik TSI mierzy podstawową siłę ruchów cen, wygładzając szumy rynkowe, aby dać Ci dokładniejszy obraz kierunku trendu. Podkreślając stany wykupienia i wyprzedania, TSI pomaga zidentyfikować potencjalne punkty zwrotne i potwierdzić kontynuacje trendu.
TSI wykorzystuje średnie kroczące podstawowego momentum instrumentu finansowego. Momentum jest uważane za wiodący wskaźnik ruchów cen, a średnia krocząca zazwyczaj pozostaje w tyle za ceną. TSI łączy te cechy, tworząc wskazanie ceny i kierunku bardziej zsynchronizowane z obrotami rynku niż samo momentum czy średnia krocząca.
Idealny dla traderów pragnących udoskonalić swoją analizę i poprawić podejmowanie decyzji, wskaźnik TSI oferuje niezawodny i intuicyjny sposób oceny dynamiki rynku. Ulepsz swój zestaw narzędzi handlowych dzięki True Strength Index dla lepszej wydajności handlu.


