
Weekly Daily Levels
Wskaźnik
2 zakupy
Wersja 1.0, Aug 2025
Windows, Mac
5.0
Opinie: 2
Opis
Czy polegasz na codziennych i tygodniowych cenach OHLC oraz punktach środkowych w swojej strategii handlowej? Masz dość ręcznego oznaczania ich za każdym razem, gdy zawierasz transakcję?
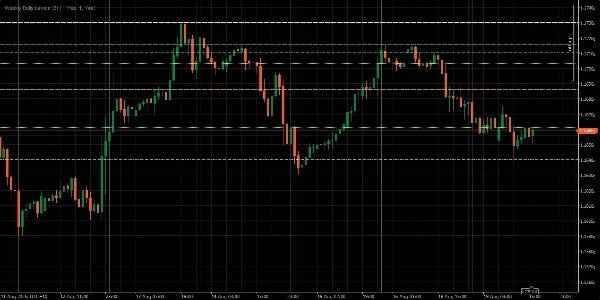
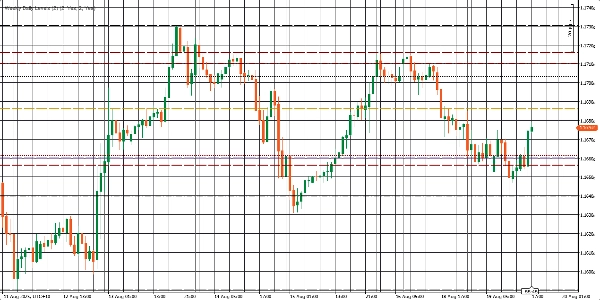
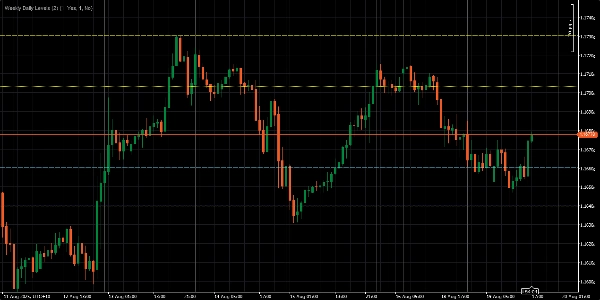
The Weekly Daily Levels Indicator wykonuje za Ciebie ciężką pracę. Automatycznie rysuje na Twoim wykresie otwarcie, maksimum, minimum, zamknięcie (OHLC) oraz ceny punktów środkowych z poprzedniego dnia i poprzedniego tygodnia. Oznacza to, że możesz skupić się na realizacji swojej strategii, podczas gdy wskaźnik zajmuje się szczegółami — co sprawia, że Twój handel jest prostszy, szybszy i znacznie bardziej efektywny.
Kluczowe funkcje:
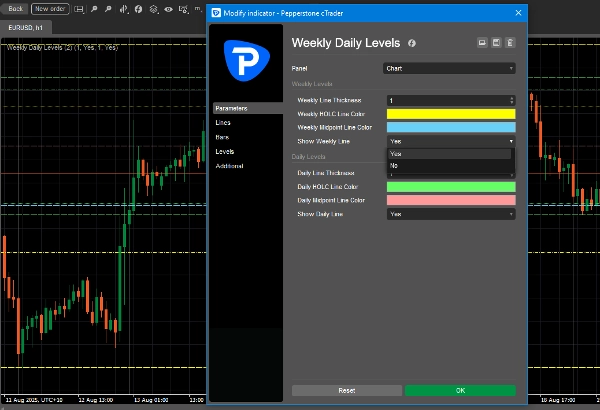
- Natychmiast wyświetla codzienne i tygodniowe ceny OHLC oraz punkty środkowe.
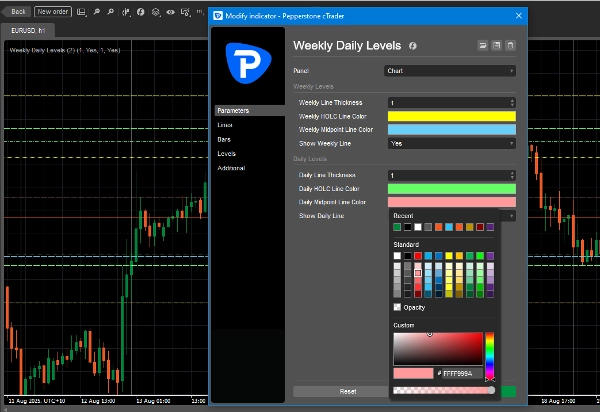
- Dostosuj kolory linii, aby pasowały do stylu Twojego wykresu.
- Włączaj lub wyłączaj poziomy dzienne lub tygodniowe za pomocą jednego kliknięcia.
- Dopasuj grubość linii dla lepszej widoczności.
Podsumowanie
Podsumowanie AI
The Weekly Daily Levels indicator automatically plots the previous day’s and previous week’s open, high, low, close (OHLC) prices along with their mid-points directly on trading charts. It provides instant visual reference to these key price levels, helping traders incorporate daily and weekly price data into their strategies without manual marking. Users can customize line colors and thickness to fit their chart style and toggle daily or weekly levels on or off with a single click. This indicator streamlines the process of tracking important historical price levels for improved trading efficiency.
Profil wskaźnika
Opinie klientów
5.0
Opinie: 2
5 | 100 % | |
4 | 0 % | |
3 | 0 % | |
2 | 0 % | |
1 | 0 % |
Opinie klientów
August 28, 2025
Not bad if the rules are already clear. Two timeframes give more context.
August 21, 2025
the good surprise is the setup needs less second guessing, and It works better with a written plan.
Dyskusja
Częste pytania
Produkty dostępne za pośrednictwem cTrader Store, w tym boty handlowe, wskaźniki i wtyczki, dostarczane są przez deweloperów zewnętrznych i udostępniane wyłącznie w celach informacyjnych oraz w celu zapewnienia dostępu technicznego. cTrader Store nie jest brokerem i nie zapewnia doradztwa inwestycyjnego, nie udziela spersonalizowanych rekomendacji ani nie gwarantuje przyszłych wyników.


![Logo „[Stellar Strategies] MARSI Signal Plotter”](https://cdn.ctrader.com/image/webp/7b2b8da6-8f8e-4646-8d4a-4710c516c01e_25567)


Cena
Od 19/04/2025
2
Sprzedaż