
Opis
Najlepszym sposobem myślenia o Composite Index w odniesieniu do RSI jest traktowanie RSI jak Windows 3.0, a Composite Index jak Windows 10. Constance Brown odkryła, że RSI, choć tworzy i wykrywa dywergencje, nie jest tak dokładny, jak mógłby być. To trochę oksymoron, ale RSI jest wskaźnikiem momentum bez żadnego obliczenia momentum do niego dołączonego. RSI pomija znaczną ilość ważnych ruchów, a nawet generuje niektóre złe sygnały. To, co Constance Brown zrobiła z RSI, to wprowadzenie obliczenia momentum wewnątrz samego RSI. Ten indeks usuwa ograniczenia zakresu normalizacji w RSI. Oznacza to, że nie jest ograniczony do zakresu 0-100.
RSI i Composite Index razem
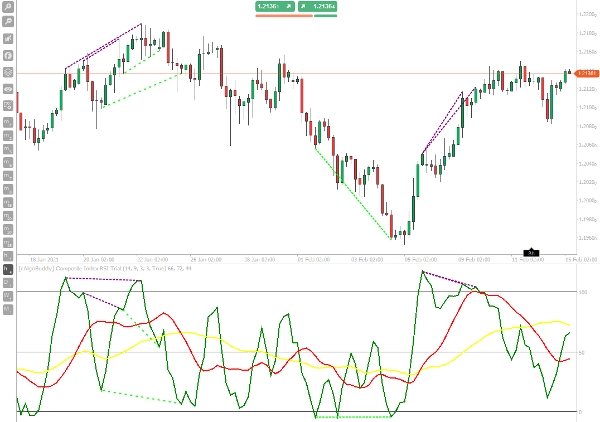
Jedną ze strategii, które Constance Brown stosowała z Composite Index, było porównanie Composite Index z RSI. Kiedy szukamy dywergencji, szukamy takich rzeczy jak dywergencja bycza. Dywergencja bycza występuje, gdy cena tworzy wyższe szczyty, ale oscylator pokazuje niższe szczyty. Kiedy używamy RSI i Composite Index razem, traktujemy RSI jak wykres cenowy, a Composite Index jako oscylator.
Wskaźnik ma wewnętrzną normalną linię RSI do wykrywania dywergencji, więc praca została wykonana za Ciebie. Handluj sygnałami dywergencji tak, jak z każdym innym oscylatorem.
Główną cechą Composite Index jest reprezentowanie momentum za pomocą wyraźnych sygnałów operacyjnych. Tak więc, gdy RSI wchodzi w strefę wykupienia lub wyprzedania, przecięcie Composite Index z jego średnimi kroczącymi w przeciwnym kierunku stanowi dobry sygnał handlowy, a następnie, łącząc tę symbiozę momentum oscylatora z działaniem ceny na wsparciach i oporach, otrzymujesz bardzo interesującą i skuteczną logikę handlową, która jest również dobrze dostosowana do handlu kryptowalutami.
Jak używać
Strategia Composite Index to strategia momentum oparta na akcji cenowej, bazująca na połączeniu poziomów wsparcia i oporu z poziomami wykupienia i wyprzedania Relative Strength Index oraz Composite Index. Composite Index w tej strategii handlowej jest również ostatecznym momentem wejścia.
Interwał czasowy: H1+, zawsze używaj tego z RSI.
Kup
- Cena odbija się od wsparcia.
- Średnie kroczące Composite RSI są poniżej poziomu 50, a szybka MA (czerwona) jest niższa niż wolna MA (żółta).
- RSI tworzy dołek, a wartość jest bliska lub poniżej 30, a także Composite Index ma dołek.
- Wchodzimy w pozycję długą w momencie, gdy Composite Index przecina średnie kroczące w górę.
Sprzedaj
- Cena odbija się od oporu.
- Średnie kroczące Composite są powyżej poziomu 50, a szybka MA (czerwona) jest wyższa niż wolna MA (żółta)
- RSI ma szczyt, a wartość jest bliska lub powyżej 70, a także Composite Index ma szczyt.
- Wchodzimy w pozycję krótką, gdy Composite Index przecina średnie kroczące w dół (to jest moment wejścia na rynek).
Podsumowanie
Opinie klientów
5 | 0 % | |
4 | 100 % | |
3 | 0 % | |
2 | 0 % | |
1 | 0 % |


