
Opis
Jeśli rynek będzie nadal poruszał się w tym nowym kierunku, w pewnym momencie zysk z transakcji w przeciwnym kierunku przewyższy stratę z transakcji początkowej, wówczas możesz zamknąć obie transakcje.
Jeśli rynek wróci do poprzedniego kierunku, przeciwna transakcja o większym rozmiarze lota będzie szybciej kumulować straty niż początkowa transakcja zyskuje. W takiej sytuacji otwieramy kolejną transakcję w kierunku początkowym, dzięki czemu transakcja początkowa i trzecia razem będą większe niż druga transakcja.
Ta strategia zabezpieczająca w formie „tam i z powrotem” może być kontynuowana aż do momentu, gdy ruch cenowy wybije się w którąkolwiek stronę.
Jak korzystać z wskaźnika Zone Recovery
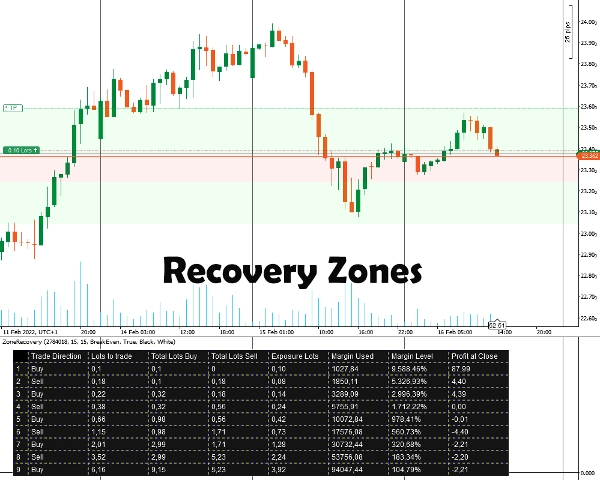
Najpierw musisz wprowadzić ID pozycji, którą chcesz zabezpieczyć. Pozycja musi mieć cel zysku. Następnie wybierasz rozmiar Zone Recovery, wpisując liczbę pipsów, przy której uważasz, że należy rozpocząć zabezpieczanie. Wskaźnik wyświetli strefy oraz tabelę, aby strategia mogła działać.
Będziesz musiał ręcznie ustawić zlecenia, stop loss i cele take profit dla wszystkich kolejnych pozycji.
Ważne informacje
Przede wszystkim Twoje konto handlowe musi być kontem typu hedging.
- W swojej istocie jest to strategia martingale, która niesie ze sobą ryzyko. Jeśli początkowa transakcja zostanie otwarta na rynku bocznym, może to szybko wyczerpać Twój depozyt zabezpieczający. Potrzebujesz instrumentów o zmiennej cenie/trendzie dla lepszych wyników.
- Instrumenty handlowe z niskimi prowizjami/małymi spreadami będą działać lepiej.
- Jeśli początkowa transakcja jest wykonana z minimalnym rozmiarem lota, kolejne obliczenia będą nieznacznie błędne z powodu błędnych obliczeń prowizji i zaokrąglonych rozmiarów lotów dla przyszłych transakcji.
- Jeśli handlujesz instrumentem innym niż waluta Twojego konta, obliczenia depozytu zabezpieczającego będą nieco niedokładne z powodu ciągłych zmian kursów walut. (Na przykład konto w EUR, otwarta pozycja w GBP/USD)
- Swapy nie są brane pod uwagę.
Opcje wskaźnika
Wskaźnik oferuje poniższe opcje:
- ID pozycji - ID otwartej pozycji, dla której chcesz obliczyć tabelę zabezpieczeń. Można wprowadzić bez początkowego „PID” (tylko liczby).
- Zone Recovery Pips - Liczba pipsów, które zostaną uwzględnione w obliczeniach strefy odzysku. Po zakończeniu strefy odzysku muszą zostać otwarte transakcje w kierunku przeciwnym do początkowej transakcji.
- Tryb obliczeń
Dostępne są dwa tryby: BreakEven i Profit
BreakEven: Obliczenia będą próbowały dobrać rozmiary lotów tak, aby mieć zerowe lub minimalne straty po zamknięciu wszystkich transakcji. Wolniejsze zużycie depozytu.
Profit: Obliczenia będą próbowały dobrać rozmiary lotów tak, aby osiągnąć cel zysku początkowej otwartej transakcji. Szybsze zużycie depozytu. - Rysuj obszary Zone Recovery - Wybierz tak, jeśli chcesz, aby obszary Zone Recovery były narysowane na wykresie.
- Kolor tabeli / kolor czcionki - Opcje kolorystyczne dla tabeli zabezpieczeń.
Podsumowanie
Opinie klientów
5 | 100 % | |
4 | 0 % | |
3 | 0 % | |
2 | 0 % | |
1 | 0 % |


![Logo „High-Low Divergence [Iridio Capital]”](https://cdn.ctrader.com/image/webp/443c4661-7abb-40f1-842f-4b6ec560649b_40914)


