
Opis
Wprowadzenie do ADX
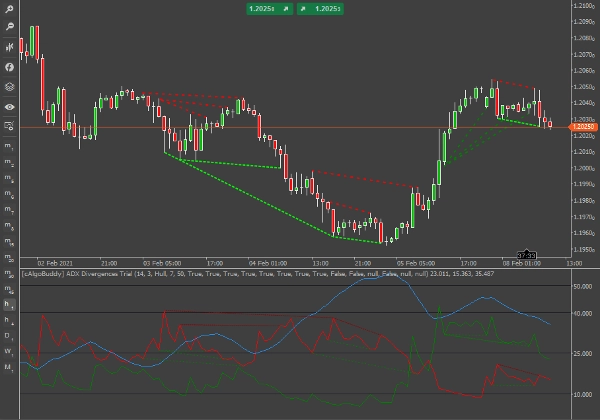
ADX (niebieska linia) jest wykreślany jako pojedyncza linia z wartościami od zera do 100. ADX jest nieskierowany; rejestruje siłę trendu niezależnie od tego, czy cena rośnie, czy spada. Wskaźnik jest zwykle wykreślany w tym samym oknie co dwie linie wskaźnika ruchu kierunkowego (Di+ i Di-), z których pochodzi ADX.
Ten wskaźnik wykrywa dywergencje na liniach Di+ i Di-. W przeciwieństwie do innych wskaźników wykrywających dywergencje, z tym możemy wydobyć więcej cennych informacji z pozostałych 2 odpowiedników sygnału dywergencji. Na przykład, jeśli dywergencja wystąpi na Di+, możemy ocenić sygnał, biorąc pod uwagę poziomy Di- i ADX.
Linie Di+ i Di- są częściowo wygładzone średnią kroczącą Hull na 3 okresach. Dla 100% szału dywergencji można ustawić okres MA na 1 i typ średniej kroczącej na prostą. Jednakże, ponieważ rysujemy dywergencje na 2 liniach w tym samym oknie wskaźnika, czasem można poczuć się przytłoczonym sygnałami. Z drugiej strony, można wybrać w ustawieniach wskaźnika dokładnie, które typy dywergencji chcemy widzieć i dla której linii (Di+ lub Di-).
Sygnał dywergencji jest uważany za potwierdzony przy otwarciu słupka następującego po dywergencji. Jednak ze względu na „sztywną” naturę linii trendu ADX (w porównaniu np. do RSI) za każdym razem, gdy pojawi się linia dywergencji, prawdopodobnie pozostanie ona tam aż do potwierdzenia, chyba że wystąpi ekstremalna zmienność.
Przed rozpoczęciem handlu na podstawie sygnału dywergencji, zidentyfikuj następujące elementy:
- Kierunek i poziom ADX
- Odległość między Di+ a Di-
- Kierunek i poziom Di+
- Kierunek i poziom Di-
Pamiętaj także
- Unikaj podejmowania jakichkolwiek transakcji na podstawie dywergencji, gdy ADX jest niski (poniżej 15 i trend spadkowy), ponieważ sygnały powinny być brane pod uwagę na podstawie już rozwiniętych lub rozwijających się trendów.
- Pamiętaj również, że przecięcie Di+ i Di- jest samo w sobie uważane za sygnał byczy/niedźwiedzi, więc odpowiednio modyfikuj swoje pozycje.
- W przypadku, gdy zarówno Di+ jak i Di- wykazują dywergencję na tym samym świeczniku, wybierz lepszą odpowiadającą linię w zależności od trendu (trend byczy/sygnał byczy Di+, trend niedźwiedzi/sygnał niedźwiedzi Di-).
- Nie musisz handlować na każdy sygnał.
Dywergencje na DiPlus
DiPlus (zielony) to linia, która wykreśla siłę trendu byczego . Możemy wykrywać dywergencje między siłą trendu byczego w podobny sposób jak większość oscylatorów.
Regularna dywergencja bycza
Definicja: Cena zrobiła niższy dołek, ale wskaźnik zrobił wyższy dołek. Idealny wynik to: Po niewielkim byczym wzroście powinniśmy zobaczyć rozwijający się trend niedźwiedzi. Wykreślona przerywaną jasną zieloną linią w oknach ceny i wskaźnika.
Dominujący trend niedźwiedzi, który zaczyna się rozwijać lub jest już rozwinięty. Wchodzimy na krótką pozycję po małej korekcie. W niektórych przypadkach dywergencja na Di+ może wystąpić na świecy niedźwiedziej, co jest dobrym potwierdzeniem dominującego trendu niedźwiedziego.
Czasami byczy wzrost rozwinie trend byczy. Może się to zdarzyć, gdy trend jest słaby lub nieobecny (Di+ i Di- są blisko siebie, ADX< 20) lub po wyczerpaniu trendu niedźwiedziego na poziomach oporu.
Ukryta dywergencja bycza
Definicja: Cena zrobiła wyższy dołek, a wskaźnik zrobił niższy dołek. Powinniśmy oczekiwać rozwoju lub kontynuacji trendu byczego. Wykreślona częściowo przerywaną ciemnozieloną linią w oknach ceny i wskaźnika.
Dominujący trend byczy, który zaczyna się rozwijać lub jest już rozwinięty. Wchodzimy na długą pozycję po małej korekcie. Stop-loss powinien być ustawiony wokół dołka świecy dywergencji.
Jeden z lepszych sygnałów tego wskaźnika, głównie dlatego, że oczekujemy natychmiastowej kontynuacji trendu i możemy utrzymać stop lossy na minimalnym poziomie.
Regularna dywergencja niedźwiedzia
Definicja: Cena zrobiła wyższy szczyt, ale wskaźnik zrobił niższy szczyt. Po niewielkim spadku niedźwiedzim powinniśmy zobaczyć rozwijający się trend byczy. Wykreślona przerywaną ciemnoczerwoną linią w oknach ceny i wskaźnika.
Dominujący trend byczy nadal rośnie (ADX nadal rośnie w czasie dywergencji).
Okoliczności tego scenariusza są bardzo rzadkie ponieważ Di+ reprezentuje siłę byczą. Zwykle okoliczności te występują po wyczerpaniu trendu byczego, co oznacza, że jest to ostatni „szczyt” przed rozpoczęciem trendu niedźwiedziego. Dlatego większość czasu zaleca się zajęcie krótkiej pozycji na ten sygnał.
Ukryta dywergencja niedźwiedzia
Definicja: Cena zrobiła niższy szczyt, a wskaźnik zrobił wyższy szczyt. Powinniśmy oczekiwać kontynuacji trendu niedźwiedziego. Wykreślona częściowo przerywaną czerwoną linią w oknach ceny i wskaźnika.
Dominujący trend niedźwiedzi z byczymi szczytami (ADX nadal rośnie w czasie dywergencji).
Oczekiwanie kontynuacji trendu niedźwiedziego z linii trendu byczego jest sprzeczne z intuicją, dlatego ten sygnał powinien być traktowany bardzo ostrożnie. Często rynek wejdzie w fazę konsolidacji po tej dywergencji.
Na rynku bez trendu unikaj podejmowania transakcji. W wyczerpanym trendzie niedźwiedzim, jeśli zdecydujesz się na krótką pozycję, stosuj skalpowanie.
Dywergencje na DiMinus
DiMinus (czerwony) to linia, która wykreśla siłę trendu niedźwiedziego. Sposób wykrywania dywergencji na cenie i DiMinus jest w pewnym sensie odwrotny do sposobu wykrywania dywergencji na DiPlus.
Regularna dywergencja bycza
Definicja: Cena zrobiła niższy dołek, ale wskaźnik zrobił niższy szczyt (zamiast wyższego dołka). Po niewielkim byczym wzroście powinniśmy zobaczyć rozwijający się trend niedźwiedzi. Wykreślona przerywaną jasną zieloną linią w oknie ceny i przerywaną ciemnoczerwoną linią w oknie wskaźnika.
Dominujący trend niedźwiedzi, który zaczyna się rozwijać lub jest już rozwinięty. Wchodzimy na krótką pozycję po małej korekcie. W niektórych przypadkach dywergencja na Di- może wystąpić na świecy niedźwiedziej, co jest dobrym potwierdzeniem dominującego trendu niedźwiedziego.
Podobnie jak sygnał pochodzący od odpowiednika Di+, czasem niedźwiedzi wzrost rozwinie trend niedźwiedzi. Może się to zdarzyć, gdy trend jest słaby lub nieobecny (Di+ i Di- są blisko siebie, ADX< 20) lub po wyczerpaniu trendu byczego na poziomach oporu.
Ukryta dywergencja bycza
Definicja: Cena zrobiła wyższy dołek, a wskaźnik zrobił wyższy szczyt (zamiast niższego dołka). Powinniśmy oczekiwać kontynuacji trendu byczego. Wykreślona częściowo przerywaną zieloną linią w oknie ceny i częściowo przerywaną ciemnoczerwoną linią w oknie wskaźnika.
Jest sprzeczne z intuicją oczekiwać kontynuacji trendu byczego z linii trendu Di-. Potrzebujemy niedźwiedzich szczytów w trendzie byczym.
Regularna dywergencja niedźwiedzia
Definicja: Cena zrobiła wyższy szczyt, ale wskaźnik zrobił wyższy dołek (zamiast niższego szczytu). Po niedźwiedzim spadku ceny powinniśmy zobaczyć kontynuację trendu byczego. Wykreślona przerywaną ciemnoczerwoną linią w oknie ceny i przerywaną jasną zieloną linią w oknie wskaźnika.
Zaleca się, w silnym i rozwijającym się trendzie byczym, zajęcie długiej pozycji. Jednak w wyczerpującym się i wyczerpanym rynku byczym, zajmij krótką pozycję.
Ukryta dywergencja niedźwiedzia
Cena zrobiła niższy szczyt, a wskaźnik zrobił niższy dołek (zamiast wyższego szczytu). Powinniśmy oczekiwać kontynuacji trendu niedźwiedziego. Wykreślona częściowo przerywaną czerwoną linią w oknie ceny i częściowo przerywaną zieloną linią w oknie wskaźnika.
Jeden z lepszych sygnałów tego wskaźnika, głównie dlatego, że oczekujemy natychmiastowej kontynuacji trendu niedźwiedziego i możemy utrzymać stop lossy na minimalnym poziomie. Stop-loss powinien być ustawiony na dołku świecy dywergencji.
Natychmiastowe powiadomienia Telegram
Zakładając, że masz skonfigurowanego bota i kanał w Telegramie, wskaźnik ADX Divergences wyśle Ci wiadomości o potwierdzonych sygnałach na parze walutowej, na której go uruchomisz. Pamiętaj, że otrzymasz sygnały tylko dla tych, które wybrałeś jako "Tak" do wyświetlania. Możesz skonfigurować tego robota handlowego, aby wysyłał natychmiastowe powiadomienia Telegram bezpośrednio na Twój komputer, tablet lub telefon komórkowy.
WAŻNE: Upewnij się, że Twoja strefa czasowa jest poprawnie ustawiona na lokalny czas (w prawym dolnym rogu aplikacji).
Powiadomienia na pulpicie
Jeśli wybierzesz Tak, wskaźnik ADX Divergences wyświetli powiadomienie w okienku na potwierdzone sygnały na Twoim osobistym pulpicie.
Powiadomienia e-mail
Aby ta funkcja działała, musisz najpierw skonfigurować cTrader, aby mógł wysyłać e-maile (Ustawienia-> E-mail). Jeśli wybierzesz Tak, wskaźnik ADX Divergences wyśle e-mail z potwierdzonymi sygnałami na adres, który wprowadziłeś.
Podsumowanie
This indicator detects divergences on both Di+ and Di- lines, allowing traders to analyze signals with additional context from the other directional lines and ADX levels. The Di+ and Di- lines are smoothed using a Hull moving average, adjustable via settings to control signal sensitivity and display preferences.
Divergence signals are confirmed at the opening of the bar following the divergence, with guidance provided on interpreting various divergence types—regular and hidden bullish and bearish divergences—on both Di+ and Di- lines. Users are advised to consider ADX levels, the distance between Di+ and Di-, and the direction and level of each line before trading signals.
The indicator supports instant alerts via Telegram messages, desktop notifications, and email, configurable within the platform. Proper time zone settings are required for accurate alert timing. This tool is applicable across multiple markets including Forex, commodities, indices, stocks, and cryptocurrencies such as BTCUSD and XAUUSD.
Opinie klientów
5 | 100 % | |
4 | 0 % | |
3 | 0 % | |
2 | 0 % | |
1 | 0 % |


![Logo „Smart Money Concepts (SMC) [Iridio Capital]”](https://cdn.ctrader.com/image/webp/28b69fd1-ef54-4bed-9487-07e78e883be4_40934)


