
Descrição
O objetivo deste algoritmo cTrader do indicador Boxify é tentar colocar a ação do preço em zonas, ou melhor, caixas. Dessa forma, o trader pode obter uma vantagem em suas posições de negociação. Este não é um indicador que pode funcionar sozinho, mas sim uma ferramenta agradável que pode complementar qualquer estratégia ou configuração de negociação.
Detectar movimentos laterais pode ajudar o trader a garantir lucros, cortar perdas ou colocar ordens limitadas a seu favor. Estas são algumas maneiras de usar uma caixa:
Detectar áreas de consolidação
Para caixas passadas que contêm várias barras dentro delas, podemos assumir com segurança que estas são áreas de consolidação e que temos um movimento lateral. Essas áreas podem servir como níveis de suporte ou resistência na sua análise da ação do preço.
Coloque suas negociações melhor
Caso você tenha uma configuração para uma negociação e veja o preço formando uma caixa, você sempre pode usar a caixa como um guia para a ação do preço, para obter uma posição mais vantajosa para sua negociação. A caixa que está se formando atualmente pode ser usada para garantir alguns lucros em uma posição vencedora, reentrar em um mercado em tendência ou colocar stops de perda.
Coloque ordens limitadas
O longo movimento lateral eventualmente levará a rompimentos. O Boxify pode ajudá-lo a colocar ordens limitadas, acima ou abaixo, para aproveitar ao máximo o início de um rompimento.
Opções do indicador
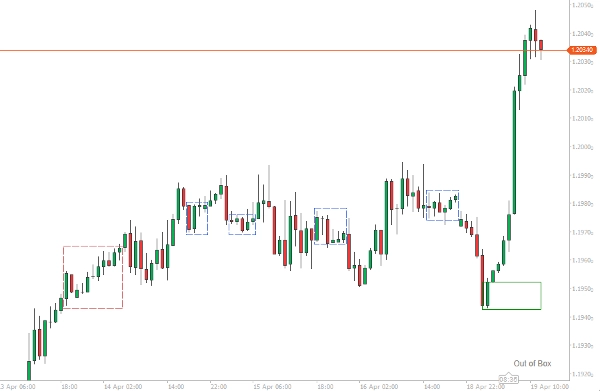
O indicador tentará formar caixas com pelo menos 2 barras ou mais. Mensagens do indicador aparecerão no canto inferior direito da área do gráfico.
- Se o preço estiver em tendência, a mensagem “Out of Box” aparecerá.
- Se o preço estiver formando caixa, a mensagem “Boxing” aparecerá.
- Se o preço estiver formando caixa e romper o limite superior, aparecerá “Breaking High”.
- Se o preço estiver formando caixa e romper o limite inferior, aparecerá “Breaking Low”.
As caixas são consideradas completas na abertura de uma nova barra, pois o preço pode sempre retrair para dentro da caixa.
Barras mínimas para a caixa
Este número representa o número mínimo de barras que uma caixa deve ter para ser considerada completa. Use números menores para pontos de entrada e números maiores para áreas de consolidação.
Filtro ATR
O Boxify possui internamente um indicador ATR, que você pode usar como uma opção de filtro, caso queira interromper a formação da caixa em qualquer barra cujo comprimento (Alta-Baixa) ultrapasse o valor do ATR. Use esta opção se quiser entrar em negociações.
Mesclar sobreposições
O início de uma caixa pode começar antes da caixa anterior ter terminado (especialmente se selecionarmos um número muito baixo para o comprimento da caixa). Podemos mesclar essas caixas com esta opção, para que possamos ver uma caixa maior se formando – Essas caixas terão uma borda de cor azul.
Tolerância
Um número que reflete a tolerância que os limites superior/inferior das caixas podem ter. Números pequenos devem ser usados quando queremos entrar em negociações, números maiores devem ser usados quando queremos encontrar áreas de consolidação.
Resumo
Avaliações de clientes
5 | 33 % | |
4 | 67 % | |
3 | 0 % | |
2 | 0 % | |
1 | 0 % |


