
الوصف
أفضل طريقة للتفكير في المؤشر المركب كما ينطبق على مؤشر القوة النسبية هي التفكير في مؤشر القوة النسبية كويندوز 3.0 والمؤشر المركب كويندوز 10. اكتشفت كونستانس براون أن مؤشر القوة النسبية، على الرغم من أنه ينشئ ويكشف عن التباينات، ليس دقيقًا كما يمكن أن يكون. من المتناقض قليلاً قول هذا لكن مؤشر القوة النسبية هو مؤشر زخم بدون أي حساب زخم مرتبط به. يفوت مؤشر القوة النسبية عددًا كبيرًا من التحركات المهمة وحتى يولد بعض التحركات السيئة. ما فعلته كونستانس براون مع مؤشر القوة النسبية هو إدخال حساب زخم داخل مؤشر القوة النسبية نفسه. يزيل هذا المؤشر قيود نطاق التطبيع في مؤشر القوة النسبية. هذا يعني أنه غير مقيد ضمن نطاق 0-100.
مؤشر القوة النسبية والمؤشر المركب معًا
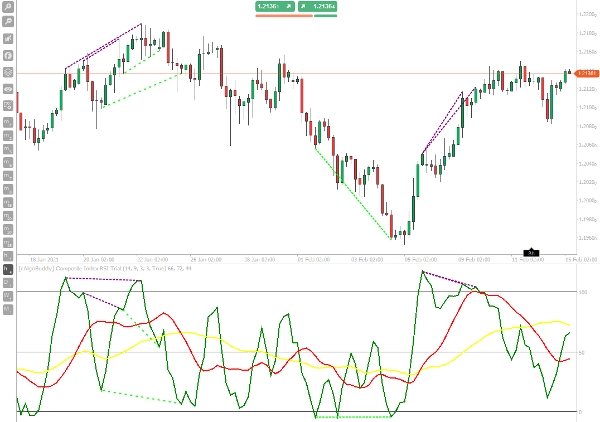
إحدى الاستراتيجيات التي استخدمتها كونستانس براون مع المؤشر المركب كانت مقارنة المؤشر المركب بمؤشر القوة النسبية. عندما نبحث عن التباينات، نبحث عن أشياء مثل التباين الصعودي. يحدث التباين الصعودي عندما يخلق السعر قممًا أعلى، لكن المؤشر المتذبذب يظهر قممًا أدنى. عندما نستخدم مؤشر القوة النسبية والمؤشر المركب معًا، نتعامل مع مؤشر القوة النسبية كما لو كان مخطط سعر والمؤشر المركب هو المؤشر المتذبذب.
يحتوي المؤشر على خط مؤشر قوة نسبية داخلي عادي لرصد التباينات، لذا تم إنجاز العمل من أجلك. قم بالتداول بناءً على إشارات التباين كما تفعل مع أي مؤشر متذبذب آخر.
الميزة الرئيسية للمؤشر المركب هي تمثيل الزخم بإشارات تشغيل واضحة. لذا، عندما يدخل مؤشر القوة النسبية منطقة التشبع الشرائي أو التشبع البيعي، يمثل تقاطع المؤشر المركب مع المتوسطات المتحركة في الاتجاه المعاكس إشارة تداول جيدة، ثم، من خلال تأطير هذا التآزر بين زخم المؤشر المتذبذب مع حركة السعر على الدعوم والمقاومات تحصل على منطق تداول مثير للاهتمام وناجح جدًا، وهو أيضًا مناسب جيدًا للتداول مع العملات المشفرة.
كيفية الاستخدام
استراتيجية المؤشر المركب هي استراتيجية حركة سعر زخم تعتمد على مزيج من مستويات الدعم والمقاومة مع مستويات التشبع الشرائي والتشبع البيعي لمؤشر القوة النسبية والمؤشر المركب. المؤشر المركب في هذه الاستراتيجية التداولية هو أيضًا توقيت الدخول النهائي.
الإطار الزمني: H1+، استخدمه دائمًا مع مؤشر القوة النسبية.
شراء
- يرتد السعر عند الدعم.
- متوسطات مؤشر القوة النسبية المركب المتحركة تحت مستوى 50 والمتوسط المتحرك السريع (الأحمر) أقل من المتوسط المتحرك البطيء (الأصفر).
- ينشئ مؤشر القوة النسبية قاعًا والقيمة قريبة أو أقل من 30 وأيضًا للمؤشر المركب قاع.
- ندخل صفقة شراء في اللحظة التي يعبر فيها المؤشر المركب المتوسطات المتحركة صعودًا.
بيع
- يرتد السعر عند المقاومة.
- متوسطات المؤشر المركب المتحركة فوق مستوى 50 والمتوسط المتحرك السريع (الأحمر) أعلى من المتوسط المتحرك البطيء (الأصفر)
- لدى مؤشر القوة النسبية قمة والقيمة قريبة أو أعلى من 70 وأيضًا للمؤشر المركب قمة.
- ندخل صفقة بيع عندما يعبر المؤشر المركب المتوسطات المتحركة هبوطًا (هذا هو توقيت الدخول في السوق).
الملخص
تقييمات العملاء
5 | 0 % | |
4 | 100 % | |
3 | 0 % | |
2 | 0 % | |
1 | 0 % |


