
Açıklama
📈 Bu gösterge, fiyat grafiğinde trendin yönünü belirlememize ve görselleştirmemize yardımcı olan bir araçtır. 📊 Çalışması, üssel hareketli ortalamalar kullanılarak trend seviyelerinin hesaplanmasına ve fiyatın hareket etmesi beklenen bölgeleri belirlemek için volatilite ölçüsüne dayanır. Aşağıda, nasıl çalıştığını detaylı olarak açıklayacağım:
📐 Trend Seviyelerinin Hesaplanması
Gösterge, "temel seviye" olarak adlandırılan şeyi hesaplayarak başlar. Bu seviye, iki üssel hareketli ortalamanın ortalaması alınarak elde edilir: biri kısa vadeli (kullanıcı tarafından belirlenen uzunlukta, bu durumda 222) ve diğeri uzun vadeli (birincinin iki katı uzunlukta). Bu ortalamalar bize genel trend için bir referans sağlar.
Sonra, volatilite kapanış fiyatlarının standart sapması kullanılarak hesaplanır ve bu değer ek bir üssel hareketli ortalama ile yumuşatılır. Yumuşatılmış volatilite, "duyarlılık" adı verilen bir parametre ile çarpılır ve bu da temel seviyenin etrafında üst ve alt seviyeleri verir. Bu seviyeler trend bantları olarak görev yapar ve fiyatın trendin üzerinde mi yoksa altında mı olduğunu belirlemeye yardımcı olur.
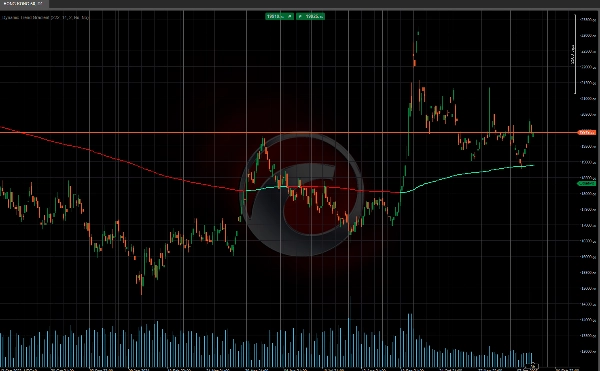
📉📈 Trend Durumu
Bu seviyeler hesaplandıktan sonra, gösterge piyasadaki trend durumunu değerlendirir. Fiyat temel seviyenin üzerindeyse, bir boğa trendi 🐂 varsayar, eğer altındaysa trend ayı 🐻 olur. Fiyat üst veya alt seviyeleri geçerse, gösterge trend sinyalini değiştirir ve olası bir dönüş veya piyasa momentumu kaymasını gösterir.
Bu araç, piyasa trendlerinin önünde olmak isteyen yatırımcılar için mükemmeldir! 🚀📉📈
Ctrader Store göstergeleri:
Dynamic Market Structure
Analysis of Turning Points
Fibonacci Linear
Regression Multi-timeframe
Multi-Level Candle Bias
Tracker
Auto Support and
Resistance Trend Lines
Özet
Müşteri değerlendirmeleri
5 | 0 % | |
4 | 100 % | |
3 | 0 % | |
2 | 0 % | |
1 | 0 % |


