Açıklama
Heikin Ashi Yapı Eğilimi (cTrader Göstergesi)
Çok zaman dilimli eğilimle otomatik arz-talep bölgeleri.
Ne yapar – basitçe anlatmak gerekirse
Bu gösterge otomatik olarak:
- Heikin Ashi fiyat hareketini okur ve anlamlı pivot değişimlerini tespit eder.
- Bu pivotlar etrafında dinamik destek ve direnç bölgeleri oluşturur, sadece rastgele çizgiler değil, fitil uçları ve mum gövdesini kullanarak.
- Yakın bölgeleri akıllıca birleştirir böylece yatay çizgiler ormanı yerine temiz, işlem yapılabilir seviyeler görürsünüz.
- Fiyat en son destek veya direnç bölgesini tamamen kırdığında net bir yükseliş veya düşüş eğilimi oluşturur.
- Aşağıdaki eğilimleri gösterir:
-
- Grafik zaman diliminiz ve
- İsteğe bağlı bir daha yüksek zaman dilimi (varsayılan H2) — grafik üzerinde HTF karmaşası olmadan.
Sonuç: Bir bakışta gerçek seviyelerin nerede olduğunu ve piyasanın şu anda yukarı mı yoksa aşağı mı eğilimli olduğunu görürsünüz.
Çözdüğü problem
Çoğu trader aynı sorunlarla karşılaşır:
- Elle çizilen destek/direnç çizgileri:
-
- öznel,
- tutarsız,
- ve genellikle aşırı çizilmiş.
- Basit “zigzag + yatay çizgi” göstergeleri:
-
- bölge genişliğini doğru yönetmez,
- seviyeleri üst üste yığar,
- ve bölgeleri o kadar uzatır ki grafik yarısını kaplar.
- Eğilim genellikle “aklınızda” olur – net göremediğiniz veya kural tabanlı kullanamadığınız bir şeydir.
Bu gösterge şunlar için tasarlanmıştır:
- Heikin Ashi yapısını net, objektif bölgelere dönüştürmek,
- Bu bölgelere dayalı kural tabanlı trend/eğilim vermek,
- Grafiği temiz ve okunabilir tutmak.
Bölgeler nasıl oluşturulur (trader dostu açıklama)
Her Heikin Ashi pivotu için gösterge bir 3 mumluk yapı inceler:
- HA kırmızıdan yeşile döndüğünde, bir destek pivotu işaretler.
- HA yeşilden kırmızıya döndüğünde, bir direnç pivotu işaretler.
Sonra bölgeyi oluşturur:
Destek bölgeleri
- 3 mum arasındaki en düşük fitili bulur (gerçek uç).
- Bu uçtan daha yüksek olan bir sonraki en düşük dip bulur.
- Bu iç dip yakınındaki mum gövdesini (açılış/kapanış) kullanarak bölgenin “işlem yapılabilir” tarafını tanımlar.
- Son destek bölgesi:
-
- Alt = uç fitil dibi,
- Üst = gövde tabanlı iç seviye.
Direnç bölgeleri
- 3 mum arasındaki en yüksek fitili bulur.
- Bu uçtan daha düşük olan bir sonraki en yüksek tepesi bulur.
- Bu iç tepe yakınındaki mum gövdesini kullanır.
- Son direnç bölgesi:
-
- Üst = uç fitil tepesi,
- Alt = gövde tabanlı iç seviye.
Yani her bölge sadece rastgele bir bant değildir:
Fiyatın gerçekten reddettiği veya döndüğü fitilden gövdeye aralıktır.
Birleştirme mantığı (grafiğin temiz kalmasının nedeni)
Aynı türdeki bölgeler (destek ile destek, direnç ile direnç):
- Zaman çizelgesinde birimler olarak ele alınır.
- Fiyat olarak gerçekten üst üste binmeleri durumunda birleşebilirler.
- Birleştirme kesinlikle yereldir:
-
- Yeni bir bölge şunlarla birleşebilir:
-
- en son bölgeyle (arka arkaya), veya
- ikinci en son bölgeyle (+1 boşluk), ve
- Eğer yeni birleşik bölge önceki yapıyla örtüşüyorsa bir ek “çapa” birleşmesi daha yapılır.
Bu davranışı sezgisel tutar:
- Bölgeler tüm geçmişi “yutmaz”.
- Eski seviyelere saygı gösterilir ama dev mega bölgeler oluşturmasına izin verilmez.
- A–B–C veya A–C+D gibi yerel yapılar kontrollü şekilde yönetilir.
Eğilim mantığı (gerçekten nasıl işlem yaparsınız)
Her zaman dilimi için (ana ve HTF):
- Gösterge en son birleşmiş destek bölgesini ve en son birleşmiş direnç bölgesini takip eder.
- Sonra, her kapanan mumda:
-
- Fiyat en son direnç bölgesinin üzerinde kapanırsa → eğilim Yükseliş olur.
- Fiyat en son destek bölgesinin altında kapanırsa → eğilim Düşüş olur.
Şunları saklar:
- Son eğilim değişiminin zamanını,
- Fiyatın bölgeyi kırdığı seviyesini.
Grafikte küçük bir metin paneli şunları gösterir:
Ana (H1) Eğilim: YükselişAna (H1) Değişim: 11/26 15:00 @1.08750
HTF etkinleştirilmişse, ayrıca şunu görürsünüz:
HTF (H2) Eğilim: DüşüşHTF (H2) Değişim: 11/25 08:00 @1.09200
Ana zaman dilimi eğilimi değiştiğinde sesli uyarı da etkinleştirebilirsiniz.
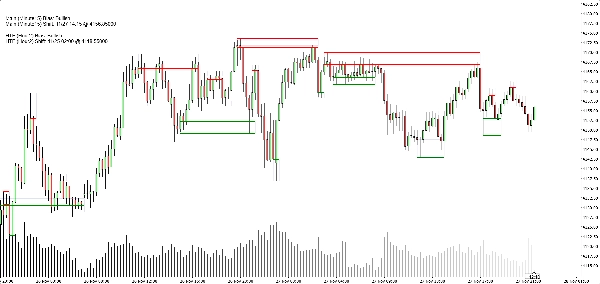
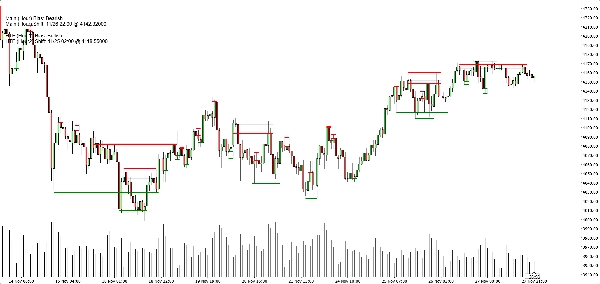
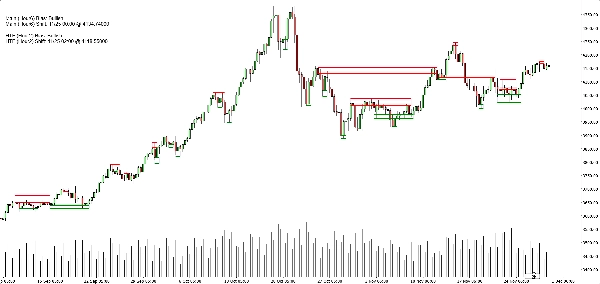
Grafikte gördükleriniz
- Destek bölgeleri:
-
- Yeşil yatay temel/tetikleyici çizgiler (isteğe bağlı),
- Tam destek bandını gösteren yumuşak lacivert dikdörtgen (çok düşük opaklıkta).
- Direnç bölgeleri:
-
- Kırmızı çizgiler + band için yumuşak lacivert dikdörtgen.
- Temiz görüntü açma/kapama seçenekleri:
-
- Destek bölgelerini göster/gizle,
- Direnç bölgelerini göster/gizle,
- Doldurulmuş dikdörtgenleri aç/kapa,
- Temel/tetikleyici çizgileri aç/kapa,
- Eğilim panelini aç/kapa.
Bu, farklı traderların şunlar arasında seçim yapmasını sağlar:
- Daha minimalist bir görünüm (belki sadece dikdörtgenler), veya
- Daha kesin bir görünüm (net çizgiler görünür).
Tipik kullanım durumları
Şunu kullanışlı olarak konumlandırabilirsiniz:
- Trend filtreleme
-
- Sadece hem ana zaman dilimi hem de HTF eğilimleri Yükseliş olduğunda alış arayın.
- Sadece ikisi de Düşüş olduğunda satış arayın.
- Bölge girişleri
-
- Bölgeleri ilgi alanları olarak kullanın:
-
- Limit emirleri,
- Onay girişleri (örneğin fiyat kırılan bölgeye geri döner ve tekrar reddeder),
- Durdurma yerleştirmesi dış banda biraz öteye.
- Yukarıdan aşağı analiz
-
- HTF eğilimi (varsayılan H2) büyük resmi gösterir,
- Grafik zaman dilimi eğilimi zamanlamayı sağlar,
- Bölgeler somut yürütme seviyeleri için kullanılır.
Olmadığı şey (dürüst satış için önemli)
- O otomatik işlem yapan bir robot değildir.
- O kâr garantileyen “kutsal kase” sinyali değildir.
- Bir yapı ve eğilim motorudur:
-
- Objektif olarak bölgeleri tanımlar,
- Bu bölgelere dayalı objektif trend/eğilim tanımlar,
- Gerçek işlem yönetimini trader/stratejiye bırakır.
Özet
Müşteri değerlendirmeleri
5 | 33 % | |
4 | 67 % | |
3 | 0 % | |
2 | 0 % | |
1 | 0 % |