
Açıklama
HIO Çoklu Döviz Stokastik Tarayıcı, piyasa analizlerinizi kolaylaştırmak için tasarlanmış gelişmiş bir gösterge paneli göstergesidir. Düzinece grafik açmak yerine, bu araç size tek bir panelden birden fazla sembol ve zaman diliminde Stokastik Osilatörü aynı anda izleme imkanı sağlar. Tüccarların potansiyel piyasa koşullarını verimli bir şekilde tanımlamasına yardımcı olur, zaman kazandırır ve çalışma alanınızı düzenli tutar.
Ana Özellikler
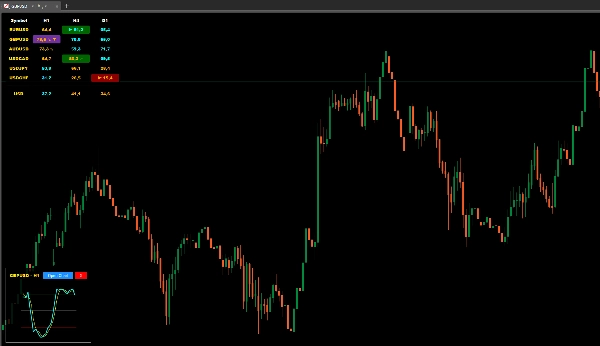
- Çoklu Sembol ve Zaman Dilimi İzleme: Seçtiğiniz zaman dilimlerinde düzinelerce döviz çiftini tek bir temiz ızgarada takip edin.
- Etkileşimli Mini Grafikler: Herhangi bir hücreye tıklayarak açılan mini grafik ile mevcut grafiğinizi terk etmeden Stokastik çizgilerini ve K/D kesişimlerini anında görselleştirin.
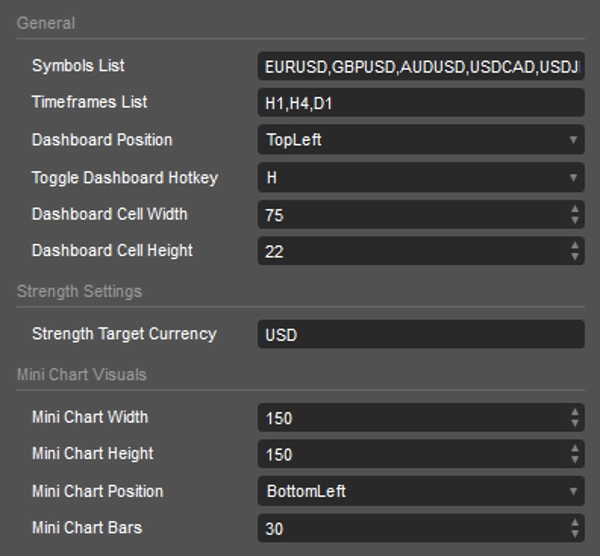
- Döviz Güç Ölçer: Stokastik ve hacim verilerine dayalı olarak hedef dövizin (örneğin USD) ağırlıklı gücünü hesaplayan özel bir satır içerir.
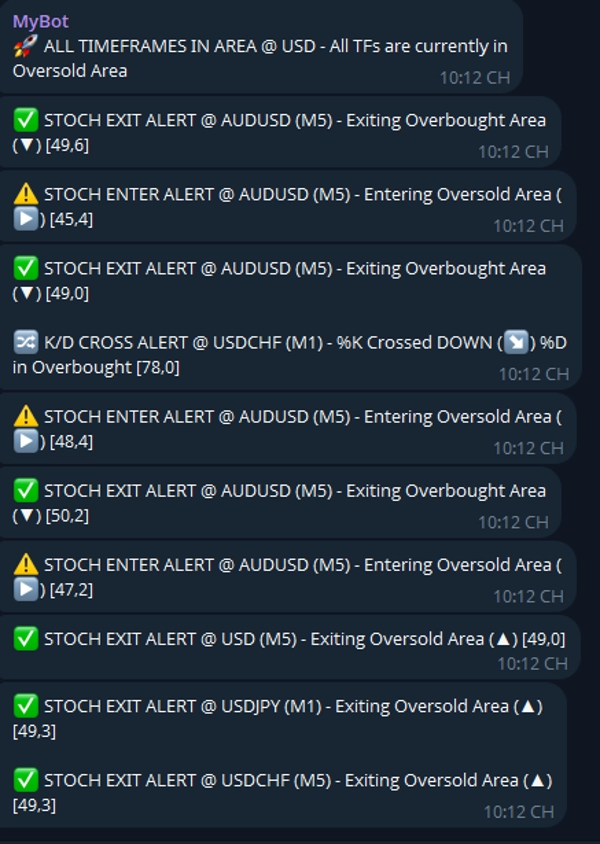
- Kapsamlı Uyarılar: Aşırı Alım (OB) ve Aşırı Satım (OS) alanlarına giriş/çıkışlar ile K/D kesişimleri için Telegram bildirimlerini destekler.
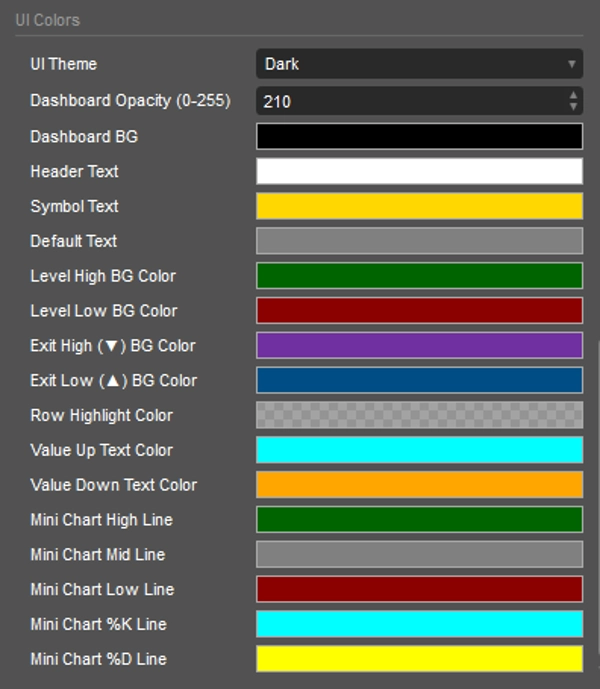
- Özelleştirilebilir Kullanıcı Arayüzü: Koyu, Açık veya Özel temalar arasında seçim yapın. Gösterge panelinin görünürlüğünü bir kısayol tuşu ile anında açıp kapatın.
Kurulum ve Parametreler
- Genel:
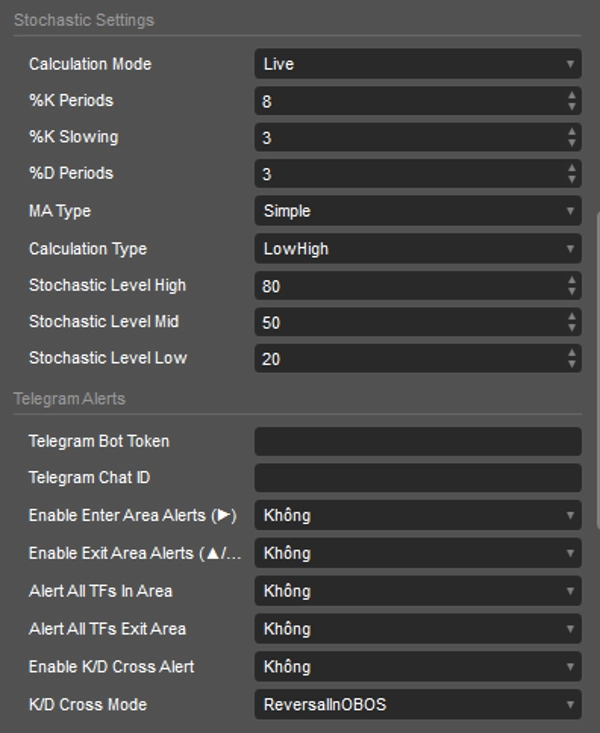
Symbols List(virgülle ayrılmış) veTimeframes Listtanımlayın.Toggle Dashboard Hotkey(varsayılan 'H') ayarlayın. - Stokastik Ayarları: Stratejinize uyacak şekilde
%K Periods,%K Slowing,%D PeriodsveMA Typetamamen özelleştirin. OB/OS sınırlarınıStochastic Level HighveStochastic Level Lowile ayarlayın. - Telegram Uyarıları:
Telegram Bot TokenveChat IDgirin. Alan Giriş/Çıkış veya K/D Çapraz Modu (Dönüş, Devam, Nötr Bölge vb.) gibi belirli uyarı tetikleyicilerini açıp kapatın.
Semboller ve Renklerin Açıklaması
- Renkler:
-
- Koyu Yeşil Arka Plan: Sembol Aşırı Alım alanındadır.
- Koyu Kırmızı Arka Plan: Sembol Aşırı Satım alanındadır.
- Aqua / Turuncu Metin: Stokastik değerinin şu anda Yükselmekte (Aqua) veya Düşmekte (Turuncu) olduğunu gösterir.
- Semboller:
-
- ▶ (Giriş): Fiyat Aşırı Alım veya Aşırı Satım bölgesine giriyor.
- ▲ (Düşük Çıkış): Fiyat Aşırı Satım bölgesinden yukarı doğru çıkıyor.
- ▼ (Yüksek Çıkış): Fiyat Aşırı Alım bölgesinden aşağı doğru çıkıyor.
- ↗ (Yukarı Kesişim): %K çizgisi %D çizgisinin üzerine çıktı.
- ↘ (Aşağı Kesişim): %K çizgisi %D çizgisinin altına indi.
HIO Çoklu Döviz Stokastik Tarayıcı, teknik tüccarlar için güçlü bir iş akışı geliştirme aracıdır. Kritik momentum verilerini merkezileştirerek, piyasanın daha net bir makro perspektifini sunar ve grafik karmaşası olmadan bilinçli kararlar almanıza yardımcı olur.
Özet
Müşteri değerlendirmeleri
5 | 50 % | |
4 | 50 % | |
3 | 0 % | |
2 | 0 % | |
1 | 0 % |


!["[Stellar Strategies] Market Session Ultimate" logosu](https://cdn.ctrader.com/image/webp/61ffd537-0125-4246-9e72-42eca1791d64_28232)


!["High-Low Divergence [Iridio Capital]" logosu](https://cdn.ctrader.com/image/webp/443c4661-7abb-40f1-842f-4b6ec560649b_40914)


