
HLC_Levels
Gösterge
4 satın almalar
Sürüm 1.0, Feb 2026
Windows, Mac
4.3
Değerlendirmeler: 3
Açıklama
Açıklama:
Her gün manuel olarak çizgi çizmeyi bırakın. Gelişmiş HLC & Oturum Seviyeleri, kurumsal referans noktalarına güvenen profesyonel traderlar için tasarlanmış kapsamlı bir göstergedir. İster Fiyat Hareketi, ICT kavramları veya Kırılma stratejileri ile işlem yapın, bu araç grafiğinizi temiz tutar ve seviyelerinizi hassas kılar.
Ana Özellikler:
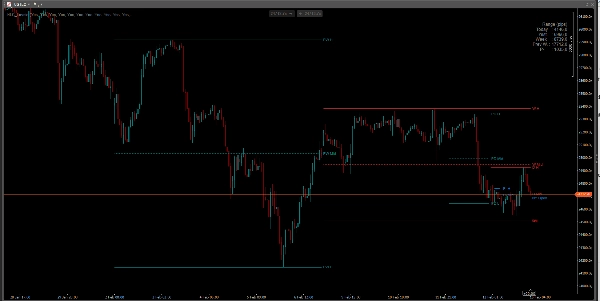
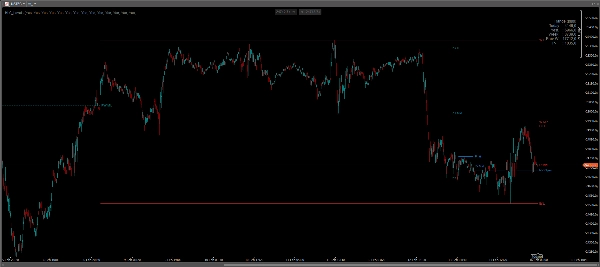
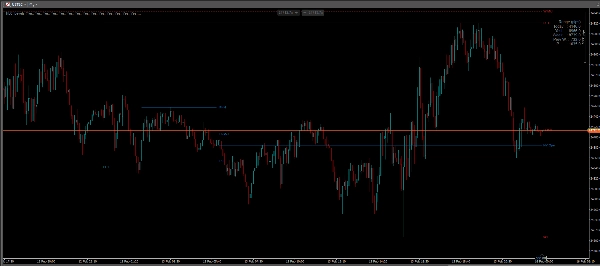
- Günlük Seviyeler: Bugünün ve Dünün Yüksek, Düşük ve Orta (50%) seviyelerini otomatik olarak gösterir.
- Haftalık Seviyeler: Mevcut ve Önceki Haftanın Yüksek, Düşük ve Orta seviyelerini görselleştirir.
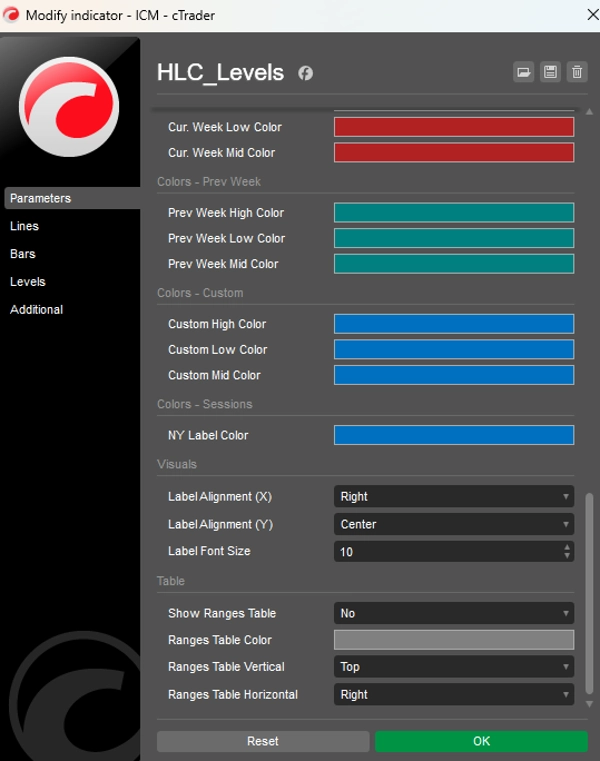
- NY Gece Yarısı Açılışı: Kurumsal New York 00:00 fiyat seviyesi (Gerçek Gün Açılışı) için özel bir açma/kapama düğmesi, yönsel eğilim için kritik öneme sahiptir.
- Özel Aralık / Oturum: Kendi zaman aralığınızı tanımlayın (örneğin, Asya Oturumu, Londra Açılışı veya İlk Denge). Gösterge, bu belirli dönem için Yüksek, Düşük ve Orta seviyeleri çizecektir.
- Volatilite Gösterge Tablosu: Gün, Dün, Hafta, Önceki Hafta ve Özel Aralığınız için pip aralığını (Yüksekten Düşüğe) gösteren grafik üstü tablo.
- Saat Dilimi Zekası: Seviyelerin stratejinizle uyumlu olmasını sağlamak için Broker zamanı, UTC, NY veya Yerel zaman ile çalışır.
Neden bu göstergeyi kullanmalısınız?
- Tepki Noktaları: Eski Yüksekler/Düşükler ve Orta noktalar genellikle güçlü destek ve direnç olarak işlev görür.
- Orta (Denge): %50 seviyesi, "İndirimli" ve "Primli" fiyatlamayı belirlemek için anahtardır.
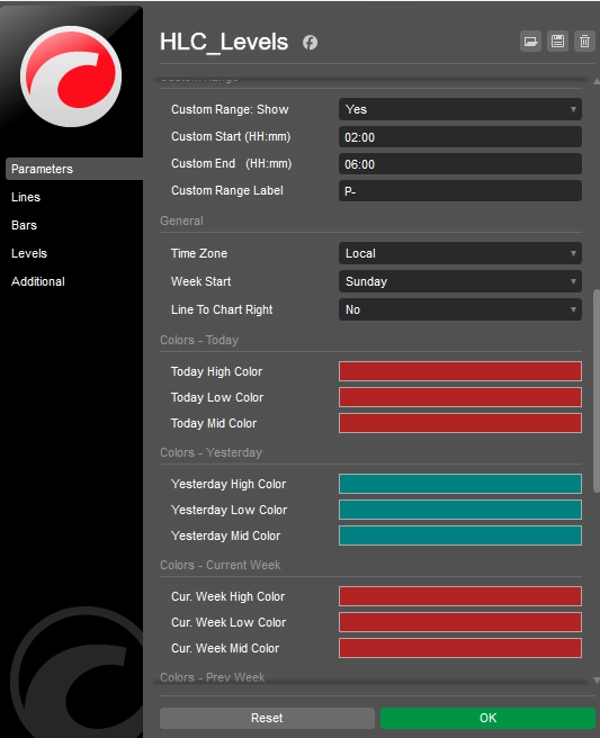
- Tamamen Özelleştirilebilir: Herhangi bir çizgiyi açıp kapatabilirsiniz. Renkleri, çizgi stillerini ve etiket pozisyonlarını şablonunuza uyacak şekilde değiştirebilirsiniz.
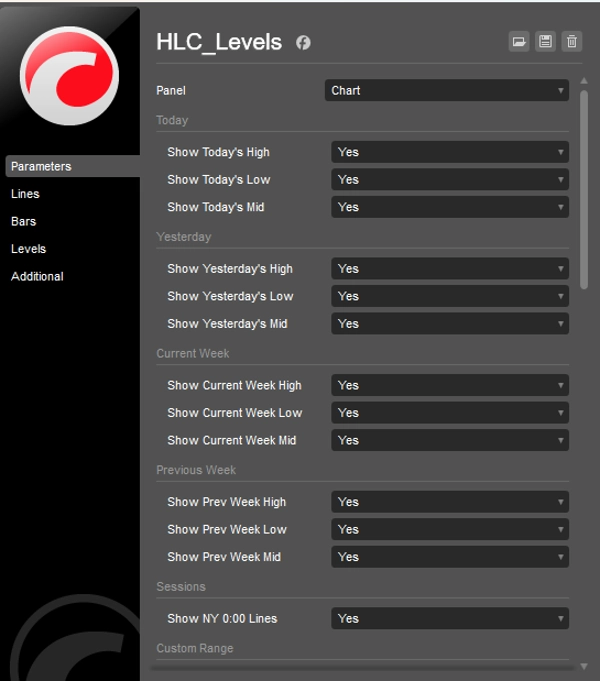
Ayarlar:
- Belirli zaman dilimlerini etkinleştir/devre dışı bırak (Bugün, Dün, Hafta, Önceki Hafta).
- Belirli oturum aralıkları için özel Başlangıç/Bitiş saatleri.
- Seviyeleri geleceğe projelendirmek için "Çizgileri Uzat" seçeneği.
- Her çizgi grubu için özel renkler.
Özet
Gösterge profili
Müşteri değerlendirmeleri
4.3
Değerlendirmeler: 3
5 | 33 % | |
4 | 67 % | |
3 | 0 % | |
2 | 0 % | |
1 | 0 % |
Müşteri değerlendirmeleri
May 16, 2026
Bit weird to see there is no Close level eventhough it's called HLC_levels.. There is a high and low and a mid, but no close. I kinda find it essential to have a close though. Other than that is safes me huge amount of time daily to not set all these levels manually. So besides the lack of the close level i still like this indicator. Would love to see a new version with the added close level as the name suggests
March 2, 2026
A 5 minute check should not become a 30 minute rabbit hole, and the entry needs one more reason to make sense.
February 21, 2026
most of the value comes from the decision gets a little more breathing room. The market context still matters.
Tartışma
SSS
Prop
Forex
Scalping
Indices
SMC
AI
XAUUSD
NAS100
USDJPY
cTrader Store üzerinden erişilebilen işlem botları, göstergeler ve eklentiler gibi ürünler, üçüncü taraf sağlayıcılar tarafından sağlanır ve yalnızca bilgilendirme ve teknik erişim amaçlarıyla sunulur. cTrader Store bir broker değildir ve yatırım tavsiyesi, kişisel öneriler vermez veya gelecekteki performansı garanti etmez.


Fiyat
24
Satışlar
662
Ücretsiz yüklemeler