
KANDIKA HEAT MAP
Wskaźnik
1 zakupy
Wersja 1.0, Jul 2025
Windows, Mac
4.6
Opinie: 3
🎨 Color Logic – Co Ci Mówi
- 🟩 Lime Green → Zmiana Trendu W Górę
Formuje się bycze momentum. Wykorzystaj to, aby złapać wczesny wzrost. - 🟥 Crimson → Zmiana Trendu W Dół
Sygnał narastającej presji spadkowej. Przygotowuje Cię na potencjalne krótkie pozycje lub wyjścia. - 🟧/🔴 Orange/Red → Strefa Wysokiej Zmienności
Spodziewaj się skoków cen, szybkich ruchów i potencjalnych pułapek. To nie miejsce na ślepe zgadywanie — potwierdź swoją strategię. - 🟦 Steel Blue → Strefa Niskiej Zmienności
Rynek zwalnia, kompresuje się lub konsoliduje. Często przygotowuje do okazji wybicia.
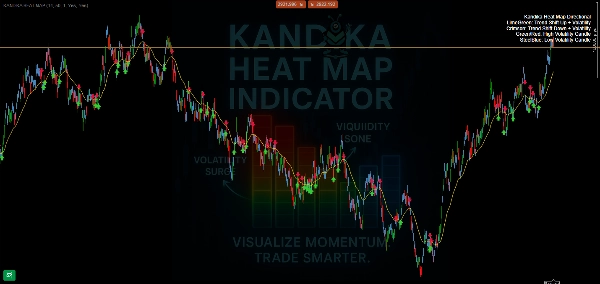
📊 Co To Robi (A Czego Nie Robi)
- ✅ Wyraźnie pokazuje zmiany kierunku trendu
- ✅ Wizualnie oddziela strefy spokoju od stref zmienności
- ✅ Prosta, przyjazna wykresom nakładka — bez bałaganu
Profil wskaźnika
4.6
Opinie: 3
5 | 67 % | |
4 | 33 % | |
3 | 0 % | |
2 | 0 % | |
1 | 0 % |
Opinie klientów
August 4, 2025
No reason to yolo this live without a few normal sessions, and Bad settings can ruin the idea.
July 26, 2025
20 percent less clicking is the line to watch. Market checks feel quicker.
Produkty dostępne za pośrednictwem cTrader Store, w tym boty handlowe, wskaźniki i wtyczki, dostarczane są przez deweloperów zewnętrznych i udostępniane wyłącznie w celach informacyjnych oraz w celu zapewnienia dostępu technicznego. cTrader Store nie jest brokerem i nie zapewnia doradztwa inwestycyjnego, nie udziela spersonalizowanych rekomendacji ani nie gwarantuje przyszłych wyników.


Od 08/06/2025
1
Sprzedaż