
E7 Polynomial Regression Channel
Indicador
889 descargas
Versión 1.0, Feb 2025
Windows, Mac
4.8
Valoraciones: 5
Descripción
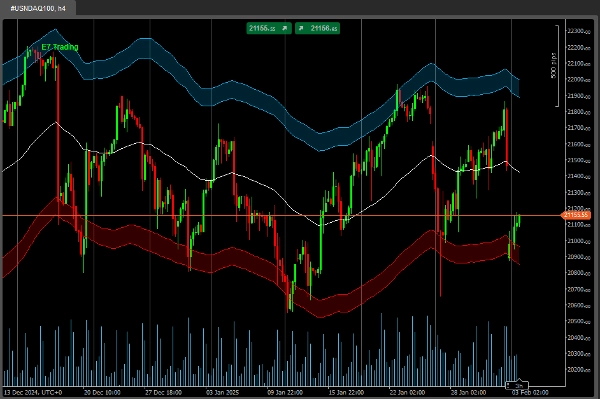
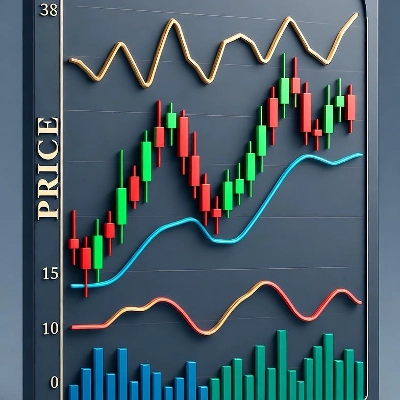
Este es un Canal de Regresión Polinómica personalizado.
También refleja la volatilidad del activo subyacente.
Esto permite un mejor análisis como se enseña en las Estrategias E7.
¡Buena caza!
Resumen
Resumen de IA
The E7 Polynomial Regression Channel is a customized technical indicator designed for market analysis. It applies polynomial regression to price data, creating a channel that adapts to the underlying asset's price movements. This channel also incorporates volatility measures, allowing users to assess market conditions more comprehensively. By reflecting both trend and volatility, it supports enhanced analysis consistent with the methodologies taught in the E7 Strategies. The indicator is intended for use in trading platforms to assist traders in identifying potential price channels and volatility shifts.
Perfil del indicador
Valoraciones de clientes
4.8
Valoraciones: 5
5 | 80 % | |
4 | 20 % | |
3 | 0 % | |
2 | 0 % | |
1 | 0 % |
Valoraciones de clientes
July 14, 2025
Pros: Polynomial regression with adjustable degree and deviation channels. Great for identifying trend zones and reversals. Works across timeframes. Cons: No alerts or tooltips. High polynomial degrees may cause lag. Lacks template saving for user settings.
May 1, 2025
This is very good Mate, i really like it, i am working o an Cbot with few indicators, could you share me this one code to include it?
Conversación
Preguntas frecuentes
Los productos disponibles a través de cTrader Store, incluidos bots, indicadores y plugins para operar, son proporcionados por desarrolladores de terceros y están disponibles únicamente con fines informativos y de acceso técnico. cTrader Store no es un bróker, por lo que no proporciona asesoramiento de inversión, recomendaciones personales ni ninguna garantía de rentabilidad futura.
Más de este autor


Precio
Desde 18/12/2024
2
Ventas
4.25K
Instalaciones gratis