
E7 Harmonic Structures Basic
インジケーター
645 ダウンロード数
バージョン 1.0、Feb 2025
Windows、Mac
5.0
レビュー: 2
説明
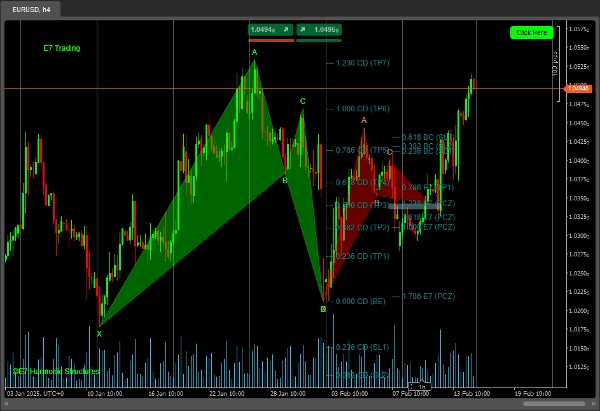
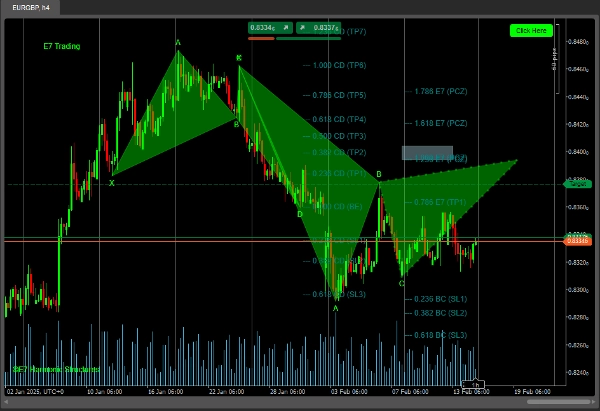
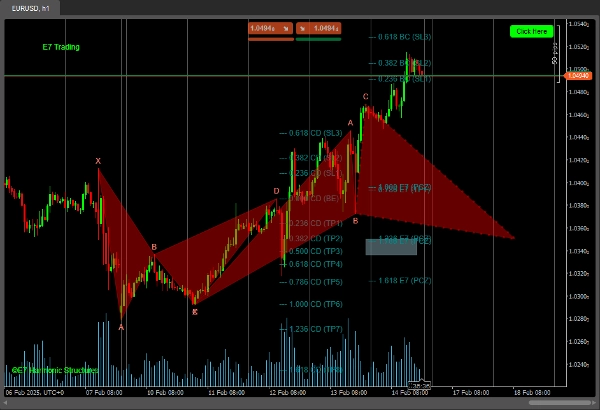
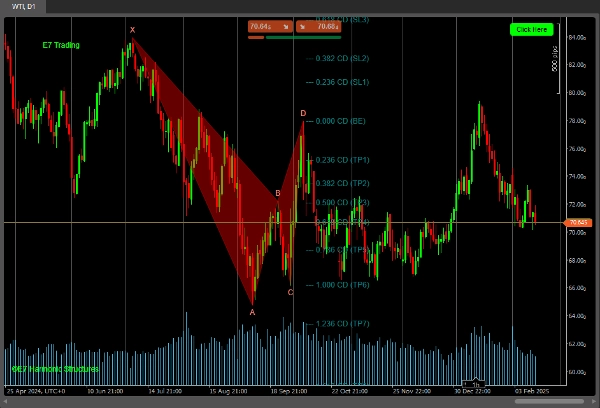
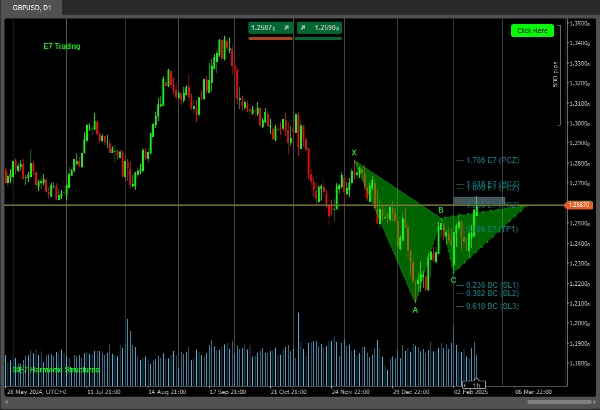
E7ハーモニックストラクチャーズベーシックインジケーターには以下が含まれます:
ポイント「C」ストラクチャーとポイント「D」ストラクチャー。
E7ストラテジーで教えられているように、より良い分析のためのFibプロジェクション、PCZおよびPRZ。
ただし、以下のストラクチャーのうち限られた数のみが含まれています:
- ガートレー
- バット
- バタフライ
- クラブ
- サイファー
* これはベータ版です。
完全版インジケーターはさらに多くのストラクチャーを含み、近日公開予定です。
ハッピー・ハンティング!
概要
AIによる概要
E7 Harmonic Structures Basic is a technical indicator designed for harmonic pattern analysis in trading. It identifies Point 'C' and Point 'D' structures and incorporates Fibonacci projections, Potential Completion Zones (PCZ), and Potential Reversal Zones (PRZ) to support detailed market analysis as outlined in E7 Strategies. The indicator currently detects a limited set of harmonic patterns, including Gartley, Bat, Butterfly, Crab, and Cypher formations. This version is labeled as Beta, with a more comprehensive version including additional structures planned for future release.
インジケーターのプロフィール
カスタマーレビュー
5.0
レビュー: 2
5 | 100 % | |
4 | 0 % | |
3 | 0 % | |
2 | 0 % | |
1 | 0 % |
カスタマーレビュー
August 12, 2025
Pros: Detects Bat, Gartley, Butterfly, Shark patterns automatically with PRZ visualization. Flexible settings. Cons: No tooltips or alerts. Missing pattern history log and template saving. Requires external confirmation (volume or PA).
April 22, 2025
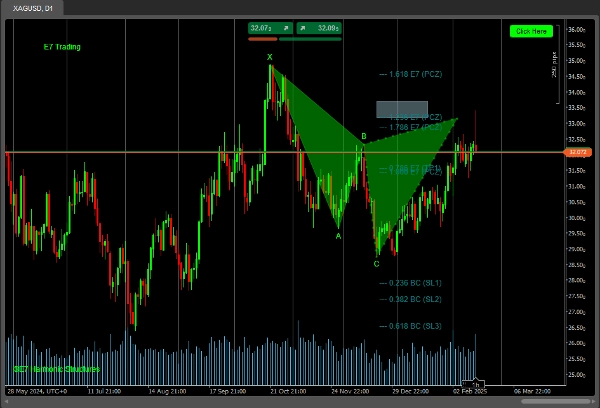
I am currently testing your indicator and I must say it is very interesting. I am a fan of Fibonacci and today, April 22, 2025, it showed two beautiful structures on gold. Like from a book about trading. Best regards and I wish you continued success in improving the product. Artur
ディスカッション
よくあるご質問
cTrader Storeで入手可能な取引ボット、インジケーター、プラグインなどの商品は、第三者の開発者が提供するものであり、情報と技術の取得のみを目的としてご利用いただけます。cTrader Storeはブローカーではなく、投資助言や個人的な推奨を行うことも、将来のパフォーマンスを保証することもありません。


これも好きかも


価格
登録日 18/12/2024
2
販売
4.26K
無料インストール