
E7 Volume Profile
インジケーター
1.15K ダウンロード数
バージョン 1.0、Feb 2025
Windows、Mac
4.6
レビュー: 3
説明
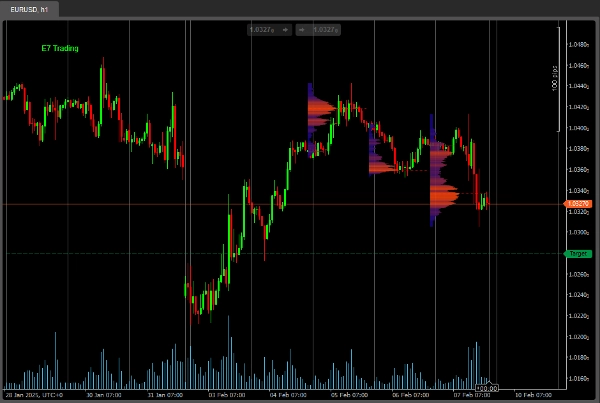
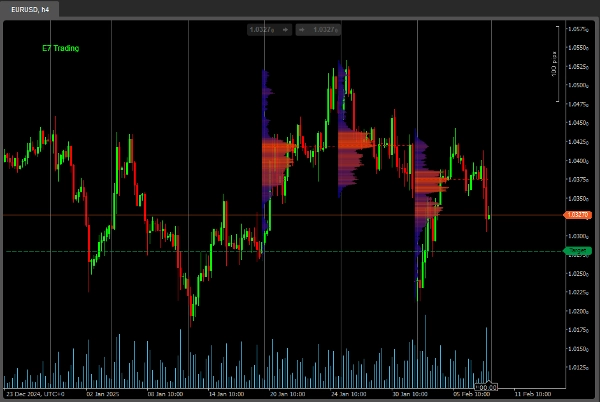
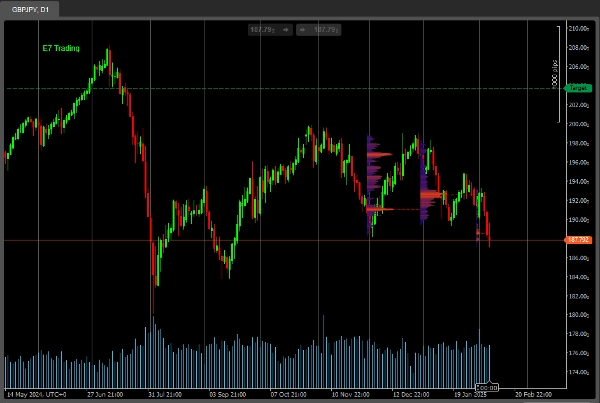
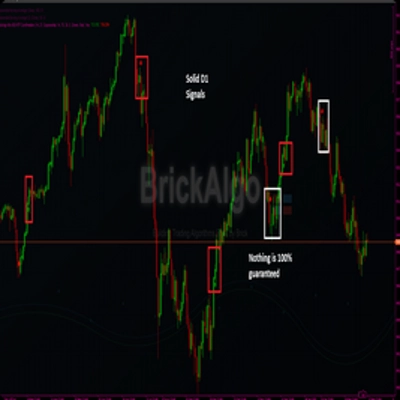
これは、よりモダンな外観と感触にカスタマイズされたシンプルなボリュームプロファイルインジケーターです。
この基本バージョンは、3つの「ルックバック期間」のみが制限されています。
フルバージョンはまもなく登場予定ですので、ご期待ください。
ハッピー・ハンティング!
概要
AIによる概要
E7 Volume Profile is a volume profile indicator designed with a modern visual style. It provides traders with volume distribution information over price levels, helping to identify key support and resistance areas. This basic version supports analysis over three distinct lookback periods, allowing users to observe volume patterns within limited historical ranges. The indicator is suitable for use on various timeframes, as illustrated by examples on 1-hour, 4-hour, and daily charts. A full version with expanded features is planned for future release.
インジケーターのプロフィール
カスタマーレビュー
4.6
レビュー: 3
5 | 67 % | |
4 | 33 % | |
3 | 0 % | |
2 | 0 % | |
1 | 0 % |
カスタマーレビュー
July 14, 2025
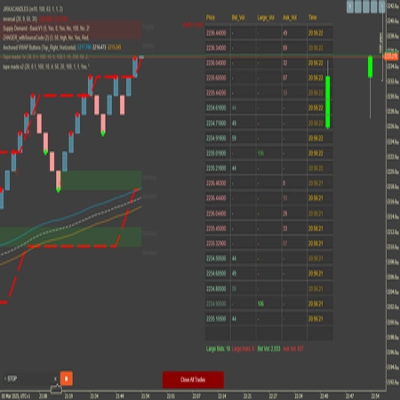
Pros: Clearly visualizes volume distribution with POC, VAH, VAL zones. Customizable and stable across timeframes. Cons: No tooltips or alerts. Lacks template saving and dynamic profile history. Requires confirmation tools for trading signals.
ディスカッション
よくあるご質問
cTrader Storeで入手可能な取引ボット、インジケーター、プラグインなどの商品は、第三者の開発者が提供するものであり、情報と技術の取得のみを目的としてご利用いただけます。cTrader Storeはブローカーではなく、投資助言や個人的な推奨を行うことも、将来のパフォーマンスを保証することもありません。
この作成者の他の商品


価格
登録日 18/12/2024
2
販売
4.24K
無料インストール