
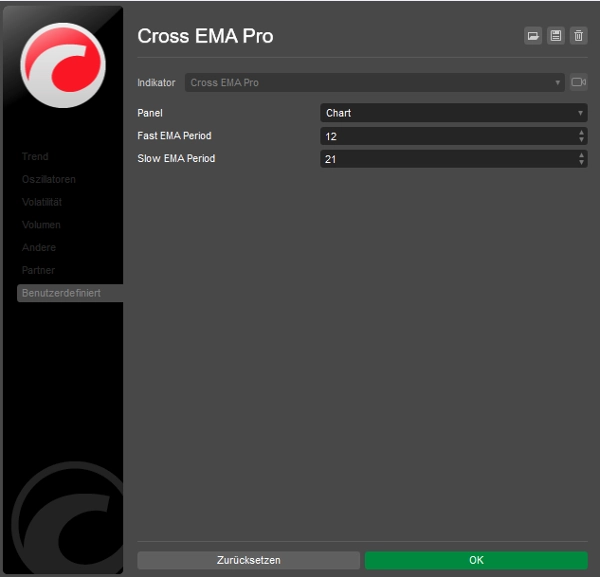
Cross EMA Pro
Indicador
2 compras
Versão 1.0, Sep 2024
Windows, Mac
4.5
Avaliações: 2
Descrição
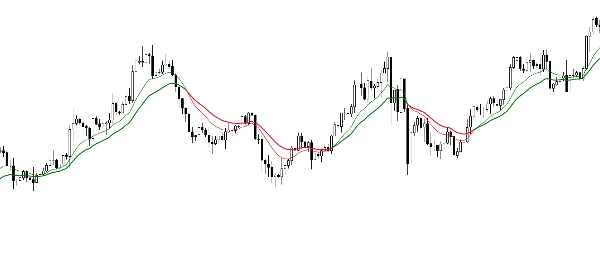
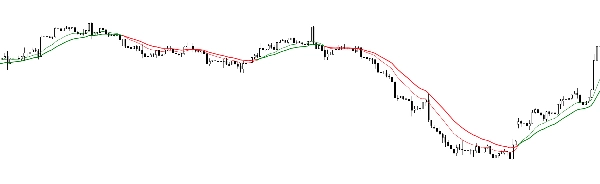
O Cross EMA Pro ajuda você a identificar com precisão reversões de tendência ao visualizar o cruzamento das EMAs de 12 e 21 períodos. A codificação por cores facilita a identificação rápida das direções da tendência.
- Sinais de Cruzamento: Baseado nas EMAs de 12 e 21 períodos
- Codificado por Cores: Verde para tendências de alta, vermelho para tendências de baixa
- Uso Flexível: Adequado para scalping, day trading e estratégias de longo prazo
Resumo
Resumo de IA
Cross EMA Pro is a trend reversal indicator that visualizes the crossover of 12-period and 21-period exponential moving averages (EMAs). It uses color coding—green for uptrends and red for downtrends—to help users quickly identify trend directions. The indicator provides clear crossover signals based on these two EMAs, making it suitable for various trading styles including scalping, day trading, and long-term strategies. It supports multiple markets such as Forex, stocks, indices, commodities, and cryptocurrencies including BTCUSD and XAUUSD. The indicator outputs visual signals on price charts to assist traders in recognizing potential trend reversals.
Perfil do indicador
Categoria do indicador
Tendência
Tipo de resultado
Visualização
Requisitos de dados
Apenas barras
Avaliações de clientes
4.5
Avaliações: 2
5 | 50 % | |
4 | 50 % | |
3 | 0 % | |
2 | 0 % | |
1 | 0 % |
Avaliações de clientes
September 22, 2024
September 22, 2024
No reason to yolo this live without a few normal sessions, and M15 is enough for the first pass.
Conversa
Perguntas frequentes
BTCUSD
Forex
Indices
Commodities
Crypto
Stocks
XAUUSD
Os produtos disponíveis através da cTrader Store, incluindo bots de negociação, indicadores e plugins, são fornecidos por programadores terceiros e são disponibilizados apenas para fins informativos e de acesso técnico. A cTrader Store não é um corretor e não fornece aconselhamento em matéria de investimento, recomendações pessoais ou qualquer garantia de desempenho no futuro.
Mais deste autor


![Logótipo de "Smart Money Concepts (SMC) [Iridio Capital]"](https://cdn.ctrader.com/image/webp/28b69fd1-ef54-4bed-9487-07e78e883be4_40934)


Preço
Desde 11/09/2024
7
Vendas