
说明
您是否在交易策略中依赖每日和每周的开盘价、最高价、最低价、收盘价(OHLC)及中点价格?每次交易时都厌倦了手动标记它们吗?
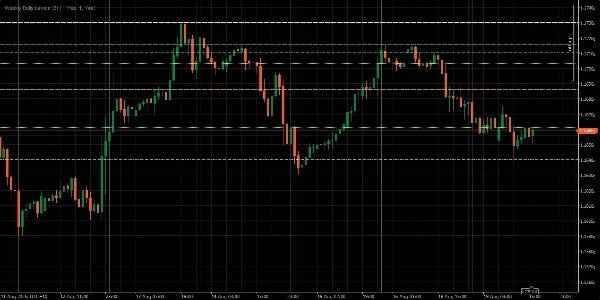
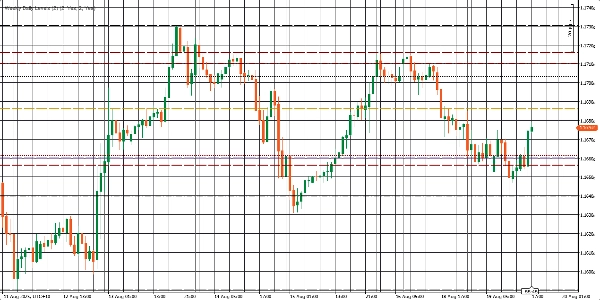
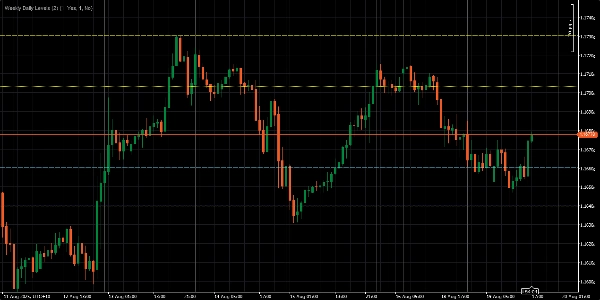
每周每日水平指标为您完成繁重的工作。它会自动在您的图表上绘制前一天和前一周的开盘价、最高价、最低价、收盘价(OHLC)及中点价格。这意味着您可以专注于执行策略,而指标负责细节——让您的交易更简单、更快速且更高效。
主要功能:
- 即时显示每日和每周的OHLC及中点价格。
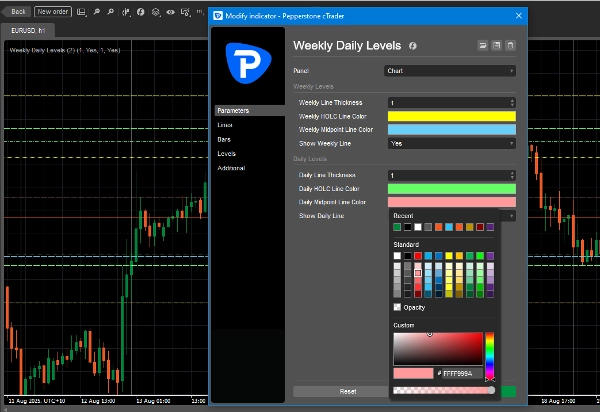
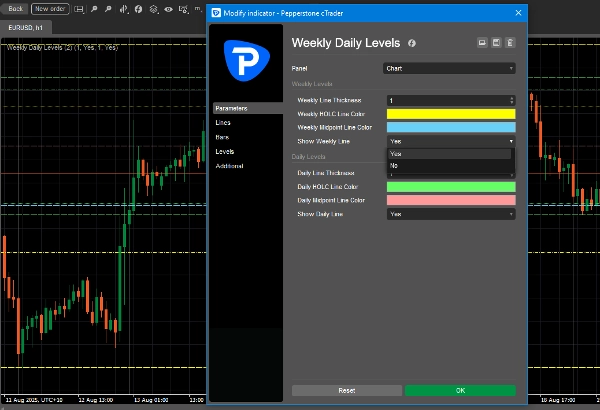
- 自定义线条颜色以匹配您的图表风格。
- 一键开启或关闭每日或每周水平线。
- 调整线条粗细以提高可见度。
摘要
AI 摘要
The Weekly Daily Levels indicator automatically plots the previous day’s and previous week’s open, high, low, close (OHLC) prices along with their mid-points directly on trading charts. It provides instant visual reference to these key price levels, helping traders incorporate daily and weekly price data into their strategies without manual marking. Users can customize line colors and thickness to fit their chart style and toggle daily or weekly levels on or off with a single click. This indicator streamlines the process of tracking important historical price levels for improved trading efficiency.
指标配置
客户评价
5.0
评价:2
5 | 100 % | |
4 | 0 % | |
3 | 0 % | |
2 | 0 % | |
1 | 0 % |
客户评价
August 28, 2025
Not bad if the rules are already clear. Two timeframes give more context.
August 21, 2025
the good surprise is the setup needs less second guessing, and It works better with a written plan.
讨论
常见问答
cTrader Store 提供的所有产品,包括交易机器人、指标和插件,均由第三方开发者提供,仅供信息参考和技术访问之用。cTrader Store 并非经纪商,不提供投资建议、个人推荐或任何未来业绩保证。


价格
注册日期 19/04/2025
2
销售