
E7 Polynomial Regression Channel
Gösterge
889 i̇ndirmeler
Sürüm 1.0, Feb 2025
Windows, Mac
4.8
Değerlendirmeler: 5
Açıklama
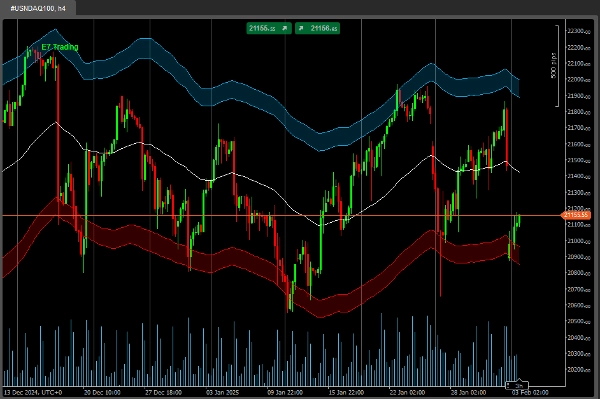
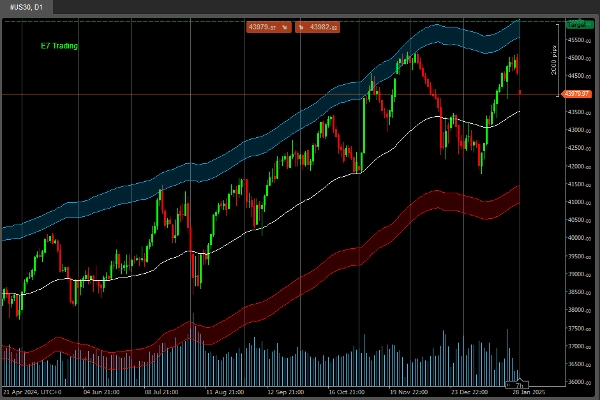
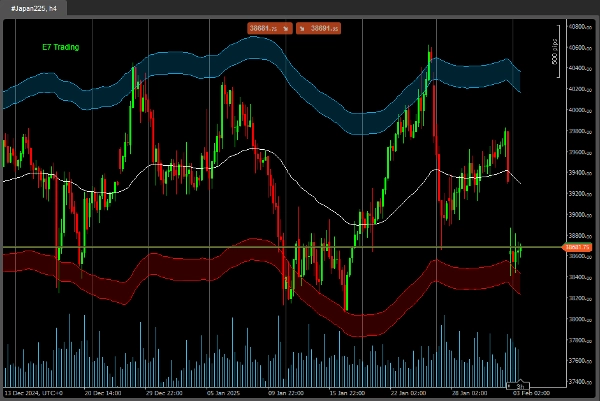
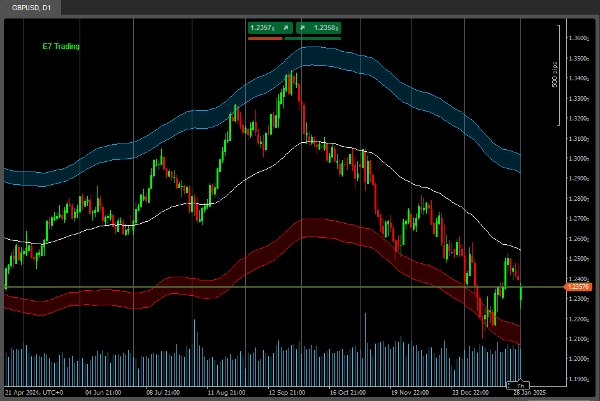
Bu özelleştirilmiş bir Polinom Regresyon Kanalıdır.
Ayrıca dayanak varlığın oynaklığını da yansıtır.
Bu, E7 Stratejilerinde öğretildiği gibi daha iyi analiz yapılmasını sağlar.
İyi avlar!
Özet
YZ özeti
The E7 Polynomial Regression Channel is a customized technical indicator designed for market analysis. It applies polynomial regression to price data, creating a channel that adapts to the underlying asset's price movements. This channel also incorporates volatility measures, allowing users to assess market conditions more comprehensively. By reflecting both trend and volatility, it supports enhanced analysis consistent with the methodologies taught in the E7 Strategies. The indicator is intended for use in trading platforms to assist traders in identifying potential price channels and volatility shifts.
Gösterge profili
Müşteri değerlendirmeleri
4.8
Değerlendirmeler: 5
5 | 80 % | |
4 | 20 % | |
3 | 0 % | |
2 | 0 % | |
1 | 0 % |
Müşteri değerlendirmeleri
July 14, 2025
Pros: Polynomial regression with adjustable degree and deviation channels. Great for identifying trend zones and reversals. Works across timeframes. Cons: No alerts or tooltips. High polynomial degrees may cause lag. Lacks template saving for user settings.
May 1, 2025
This is very good Mate, i really like it, i am working o an Cbot with few indicators, could you share me this one code to include it?
Tartışma
SSS
cTrader Store üzerinden erişilebilen işlem botları, göstergeler ve eklentiler gibi ürünler, üçüncü taraf sağlayıcılar tarafından sağlanır ve yalnızca bilgilendirme ve teknik erişim amaçlarıyla sunulur. cTrader Store bir broker değildir ve yatırım tavsiyesi, kişisel öneriler vermez veya gelecekteki performansı garanti etmez.
Bu oluşturanın diğer ürünleri


Fiyat
Başlangıç 18/12/2024
2
Satışlar
4.25K
Ücretsiz yüklemeler